Abstract
Background and Objective: Hepatocellular carcinoma (HCC) is a highly aggressive malignant tumor of the digestive system worldwide. Chronic hepatitis B virus (HBV) infection and aflatoxin exposure are predominant causes of HCC in China, whereas hepatitis C virus (HCV) infection and alcohol intake are likely the main risk factors in other countries. It is an unmet need to recognize the underlying molecular mechanisms of HCC in China.
Methods: In this study, microarray datasets (GSE84005, GSE84402, GSE101685, and GSE115018) derived from Gene Expression Omnibus (GEO) database were analyzed to obtain the common differentially expressed genes (DEGs) by R software. Moreover, the gene ontology (GO) functional annotation and Kyoto Encyclopedia of Genes and Genomes (KEGG) pathway analysis were performed by using Database for Annotation, Visualization and Integrated Discovery (DAVID). Furthermore, the protein-protein interaction (PPI) network was constructed, and hub genes were identified by the Search Tool for the Retrieval of Interacting Genes (STRING) and Cytoscape, respectively. The hub genes were verified using Gene Expression Profiling Interactive Analysis (GEPIA), UALCAN, and Kaplan-Meier Plotter online databases were performed on the TCGA HCC dataset. Moreover, the Human Protein Atlas (HPA) database was used to verify candidate genes’ protein expression levels.
Results: A total of 293 common DEGs were screened, including 103 up-regulated genes and 190 down-regulated genes. Moreover, GO analysis implied that common DEGs were mainly involved in the oxidation-reduction process, cytosol, and protein binding. KEGG pathway enrichment analysis presented that common DEGs were mainly enriched in metabolic pathways, complement and coagulation cascades, cell cycle, p53 signaling pathway, and tryptophan metabolism. In the PPI network, three subnetworks with high scores were detected using the Molecular Complex Detection (MCODE) plugin. The top 10 hub genes identified were CDK1, CCNB1, AURKA, CCNA2, KIF11, BUB1B, TOP2A, TPX2, HMMR and CDC45. The other public databases confirmed that high expression of the aforementioned genes related to poor overall survival among patients with HCC.
Conclusion: This study primarily identified candidate genes and pathways involved in the underlying mechanisms of Chinese HCC, which is supposed to provide new targets for the diagnosis and treatment of HCC in China.
Introduction
Liver cancer is the sixth most common cancer and the fourth leading cause of cancer-related death worldwide, posing a significant challenge to public health [1]. Hepatocellular carcinoma (HCC) accounts for approximately 90% of all primary liver cancers [2]. Genetic abnormalities, cellular context, and external environment play essential roles in the development of HCC. Interestingly, the main risk factors of HCC vary by region. For example, because of diverse traditional dietary habits and diseases susceptibility, the predominant causes of HCC are chronic hepatitis B virus (HBV) infection and aflatoxin exposure in China, whereas hepatitis C virus (HCV) infection and alcohol intake are likely the main risk factors in other countries [1, 3]. It has been reported that more than 120 million people carried hepatitis B surface antigen (HBsAg), and approximately 54% of HCCs are attributed to HBV infection in China [2, 4]. In addition, Non-alcoholic fatty liver disease (NAFLD) is increasingly a cause of cirrhosis and hepatocellular carcinoma in China with the popularity of the sedentary lifestyle and fast food culture brought by the expansion of urbanization in recent years [5]. Since HCC has its unique genetic and environmental background in China, it is vital to investigate the molecular mechanisms involved in the occurrence, progression, and metastasis of HCC from China to improve diagnostic and therapeutic strategies. Therefore, it is an unmet need to identify relevant genes and signaling pathways involved in the pathophysiology of HCC to achieve effective diagnosis and treatment in the early stage of HCC in China.
In recent years, bioinformatics analysis based on microarrays and high-throughput sequencing technologies has been widely used to identifying differentially expressed genes (DEGs) and functional pathways related to the occurrence and development of various diseases [6, 7]. However, given the high false-positive rates, it is difficult to obtain reliable results from independent microarrays or high-throughput sequencing analysis. Fortunately, to get reliable results, integrated bioinformatics analyses have been developed to perform a large-scale analysis of cross-platform microarrays or high-throughput data.
In this study, microarray datasets GSE84005 [8], GSE84402 [9], GSE101685 (unpublished), and GSE115018 [10] about HCC in China derived from Gene Expression Omnibus (GEO) database were downloaded and analyzed to obtain DEGs between HCC tissues and normal tissue. Subsequently, Gene Ontology (GO) functional enrichment analysis and Kyoto Encyclopedia of Genes and Genomes (KEGG) pathway enrichment analysis was performed. Furthermore, protein-protein interaction (PPI) networks were constructed to identify subnetworks and hub genes. Above all, this work is supposed to identify potential candidate genes and provide new therapeutic targets for the advancement of HCC from China.
Materials and Methods
Microarray Data
With the continuous innovation of high-throughput technology, the results of some outdated datasets are relatively inaccurate. In order to eliminate the errors caused by the imbalance of high-throughput sequencing technology, the microarray datasets were searched from the Gene Expression Omnibus (GEO) database (https://www.ncbi.nlm.nih.gov/geo/) from January 1st, 2016 to October 30th, 2019 using the following keywords: “hepatocellular carcinoma or HCC” (study keyword), “Homo sapiens” (organism), “Expression profiling by array” (study type) and “tissue” (attribute name). After a systematic review (Supplementary Figure S1), four gene expression profiles about HCC in China (GSE84005, GSE84402, GSE101685, and GSE115018) were collected for further analysis. GSE84402 and GSE101685 were based on the platforms of GPL570 [HG-U133_Plus_2] Affymetrix Human Genome U133 Plus 2.0 Array, while GSE84005 and GSE115018 were GPL5175 [HuEx-1_0-st] Affymetrix Human Exon 1.0 ST Array and GPL20115 Agilent-067406 Human CBC lncRNA + mRNA microarray V4.0 respectively. lncRNA data of GSE115018 were not analyzed in this study. GSE84005 (Beijing), GSE84402 (Shanghai), GSE101685 (Taipei), and GSE115018 (Nanning) contain 38, 14, 8, and 12 cases of normal tissues and 38, 14, 24, and 12 cases of HCC tissues from Chinese patients separately.
Screening for Common Differentially Expressed Genes
The GEOquery package was used to download the series matrix of the four databases in R (v3.6.1). The gene expression data were subjected to quantile normalization by the Linear Models for Microarray Data (limma) package before analysis. The limma package was used to identify DEGs between normal tissues and HCC tissues in each dataset, which is based on unpaired t-test. The DEGs were identified according to the thresholds that adjusted p value (adj.P.Val) < 0.05 and |log fold change (FC)| > 1. The DEGs were visualized using the pheatmap and the ggplot2 packages. The DEGs intersection of four datasets was used to obtain the common DEGs of HCC in China by Venny 2.1.0 (https://bioinfogp.cnb.csic.es/tools/venny/index.html.).
Gene Ontology and Kyoto Encyclopedia of Genes and Genomes Pathway Enrichment Analyses
The Database for Annotation, Visualization, and Integrated Discovery (DAVID 6.8, https://david.ncifcrf.gov/) is a shared database for gene enrichment and functional annotation analysis, which integrates biodata and analytical tools to provide a systematic and comprehensive annotation of biological functions for large-scale lists of genes or proteins [11]. In order to preliminary understand biological functions and pathway enrichment of the common DEGs, GO and KEGG pathway enrichment analysis was performed by using DAVID online tool. The results of GO and KEGG pathway enrichment analysis TXT files were downloaded and visualized using the R. p < 0.05 was considered statistically significant.
Protein-Protein Interaction Network Construction and Subnetwork Analysis
The Search Tool for the Retrieval of Interacting Genes (STRING v11, https://string-db.org/) is designed to construct a critical assessment and integration of protein-protein interaction (PPI) network [12]. To understand the interactional correlation of the common DEGs, a PPI network was established by STRING, and then the results of the PPI network TSV file were downloaded and visualized by Cytoscape (3.7.2) that is a public bioinformatics software [13]. Furthermore, the Molecular Complex Detection (MCODE) plugin [14] was also applied to select the significant subnetworks from the PPI network (degree cutoff ≥ 2, node score cutoff ≥ 0.2, K-core ≥ 2, and max depth = 100, score ≥ 5). Moreover, the KEGG analyses for genes in subnetworks were used to investigate their potential biological functions using DAVID. p < 0.05 was considered statistically significant.
Hub Genes Identification and Prognosis Analysis
In the PPI network, hub genes, the top ten genes with the highest degree, were identified using the CytoHubba plugin [15]. The Gene Expression Profiling Interactive Analysis (GEPIA, http://gepia.cancer-pku.cn) was used to evaluate mRNA expression of hub genes in The Cancer Genome Atlas (TCGA) database [16]. Besides, the Human Protein Atlas (HPA, https://www.proteinatlas.org/) database was used to verify the protein expression level of candidate genes in HCC tissues [17]. Furthermore, the association between selected genes and the prognosis of HCC was analyzed using UALCAN (http://ualcan.path.uab.edu) online tool on TCGA HCC cases [18]. According to the upper quartile cutoff levels of gene expression, the HCC cases in the TCGA database cases are separated into high-expression and low/medium-expression groups in survival analysis. p < 0.05 was considered statistically significant. To further clarify the influence of the region, environment, and living habits on survival outcomes, we conducted a subgroup analysis of HCC patients by ethnicity using Kaplan-Meier Plotter (https://kmplot.com/), whose primary purpose is a meta-analysis based on discovery and validation of survival biomarkers [19]. There were 364 HCC patients with available clinical data, including 184 White/Caucasian and 158 Asian. p < 0.05 was considered statistically significant. The methods above are summarized in Supplementary Figure S2.
Results
Identification of Common DEGs of HCC From China
Four gene expression matrices were normalized before analysis, and the results are shown in Supplementary Figure S3. In addition, there was 1028 (397 up-regulated genes, 631 down-regulated genes), 1720 (607 up-regulated genes, 1113 down-regulated genes), 1044 (386 up-regulated genes, 658 down-regulated genes) and 1282 (497 up-regulated genes, 785 down-regulated genes) screened from GSE84005, GSE84402, GSE101685 and GSE115018 respectively in Table 1, Figures 1A–D and Supplementary Figure S4. Furthermore, through the DEGs intersection of four datasets using Venny 2.1.0, a total of 293 common DEGs were identified, including 103 up-regulated genes and 190 down-regulated genes (Figures 2A,B, Supplementary Tables S1, S2).
TABLE 1
| GEO | Sample | City | Up-regulated genes | Down-regulated genes | Total of DEGs |
|---|---|---|---|---|---|
| GSE84005 | HCC | Beijing | 397 | 631 | 1028 |
| GSE84402 | HCC | Shanghai | 607 | 1113 | 1720 |
| GSE101685 | HCC | Taipei | 386 | 658 | 1044 |
| GSE115018 | HCC | Nanning | 497 | 785 | 1282 |
Information of DEGs identified from each dataset from China.
DEGs, differentially expressed genes; GEO, gene expression omnibus; HCC, hepatocellular carcinoma.
FIGURE 1
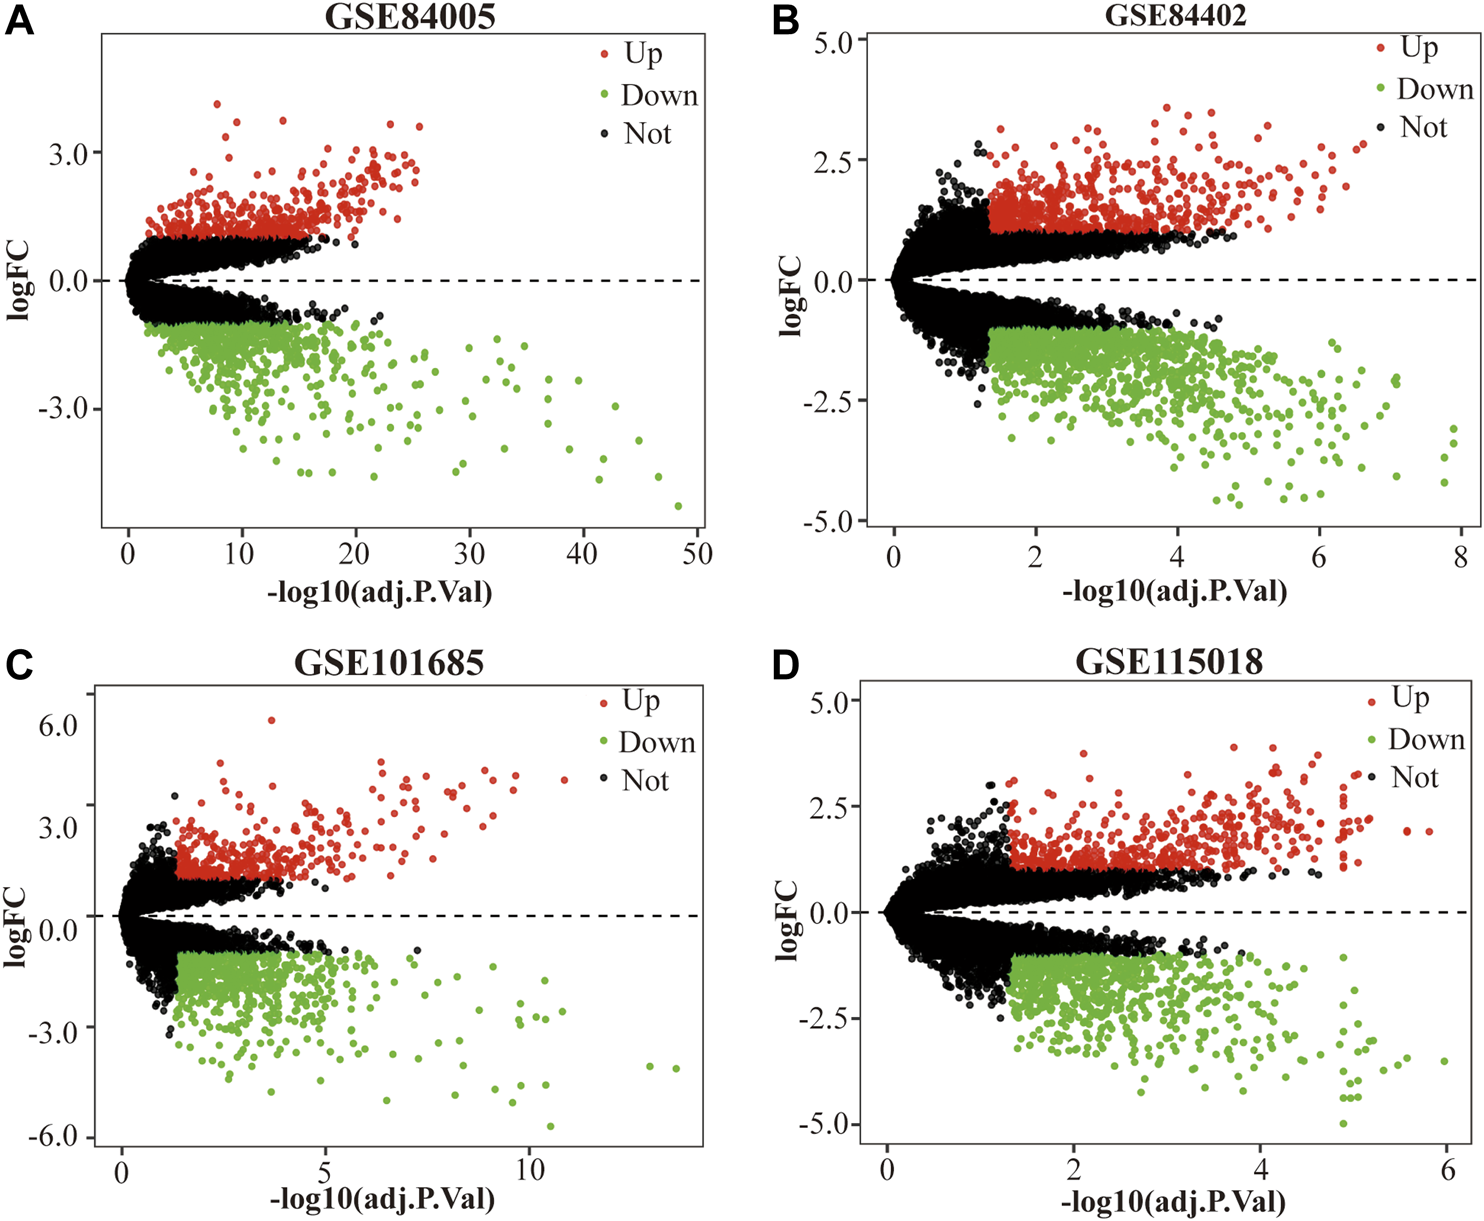
The DEGs between HCC tissue samples and normal tissue samples in each dataset. (A) GSE84005, (B) GSE84402, (C) GSE101685 and (D) GSE115018. The red dots represent the upregulated genes based on adjusted p value (adj.P.Val) < 0.05 and log fold change (FC) > 1, the green dots represent the downregulated genes based on adj.P.Val <0.05 and log FC < 1; the black spots represent genes with no significant difference. DEGs, differentially expressed genes. HCC, hepatocellular carcinoma.
FIGURE 2
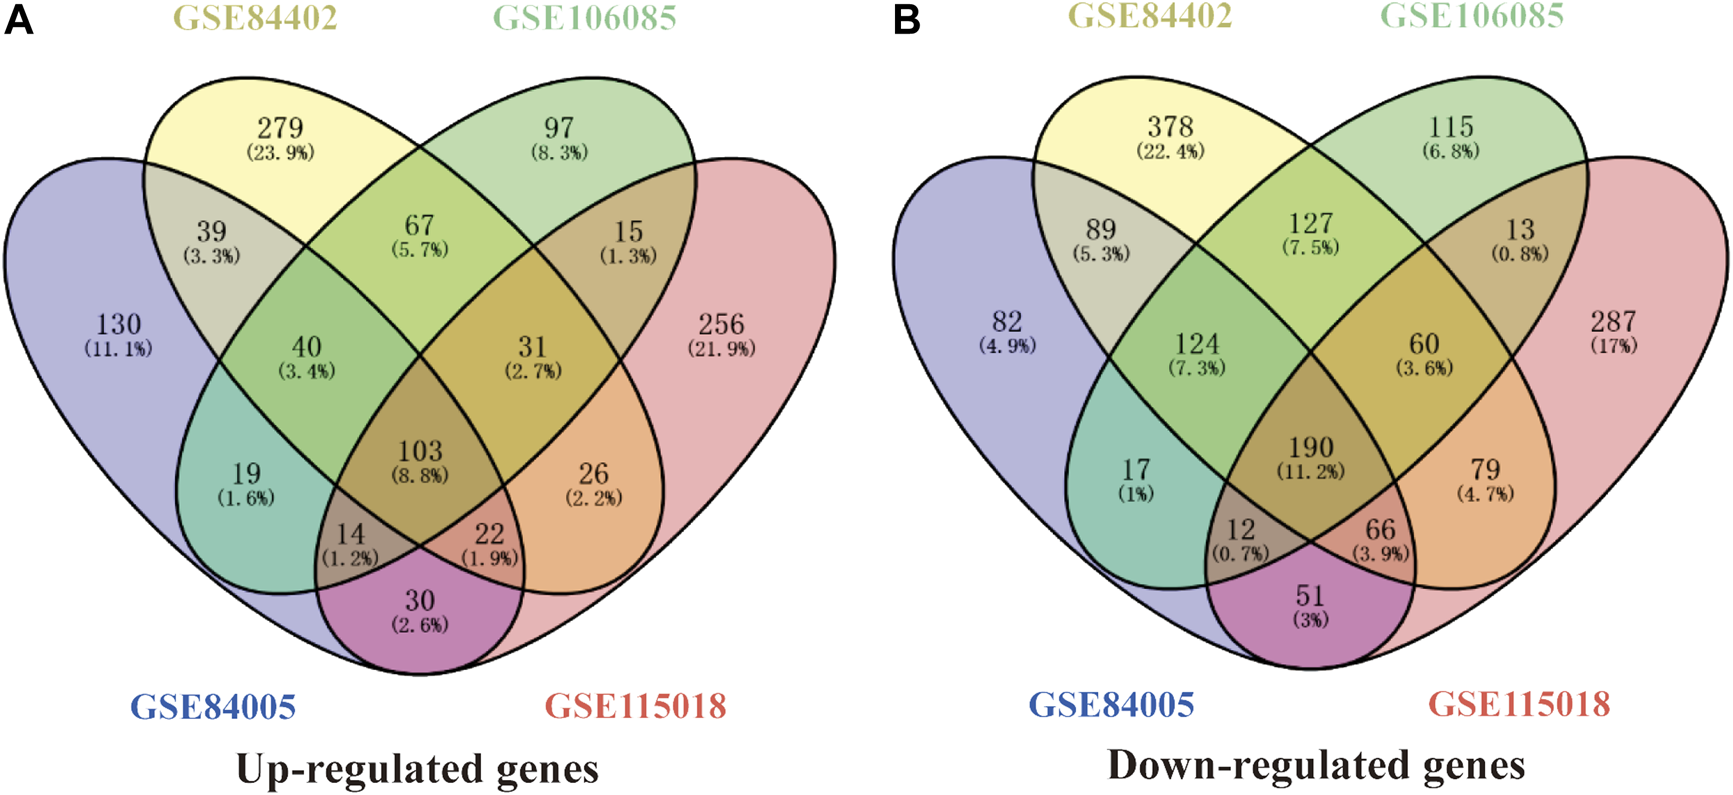
A total of 293 common DEGs were identified from the four HCC datasets in China. (A) and (B) represents 103 common up-regulated genes and 190 common down-regulated genes identified from GSE84005, GSE84402, GSE101685, and GSE115018 datasets. DEGs, differentially expressed genes.
Gene Ontology and Kyoto Encyclopedia of Genes and Genomes Pathway Enrichment Analyses
GO analysis consists of three functional parts, including biological process (BP), cellular component (CC), and molecular function (MF). As shown in Figure 3 and Supplementary Table S3, the results of GO analysis indicated that the common DEGs were enriched in the BP, including oxidation-reduction process, cell division, mitotic nuclear division, positive regulation of cell proliferation, and proteolysis. For the CC, the common DEGs were principally enriched in the cytosol, nucleoplasm, extracellular exosome, extracellular region, and extracellular space. As for the MF, the common DEGs were mainly enriched in protein binding, ATP binding, protein homodimerization activity, protein kinase binding, and serine-type endopeptidase activity. Additionally, the KEGG pathway enrichment analysis results revealed that the common DEGs were particularly enriched in metabolic pathways, complement and coagulation cascades, cell cycle, p53 signaling pathway, and tryptophan metabolism shown in Figure 4 and Supplementary Table S4.
FIGURE 3
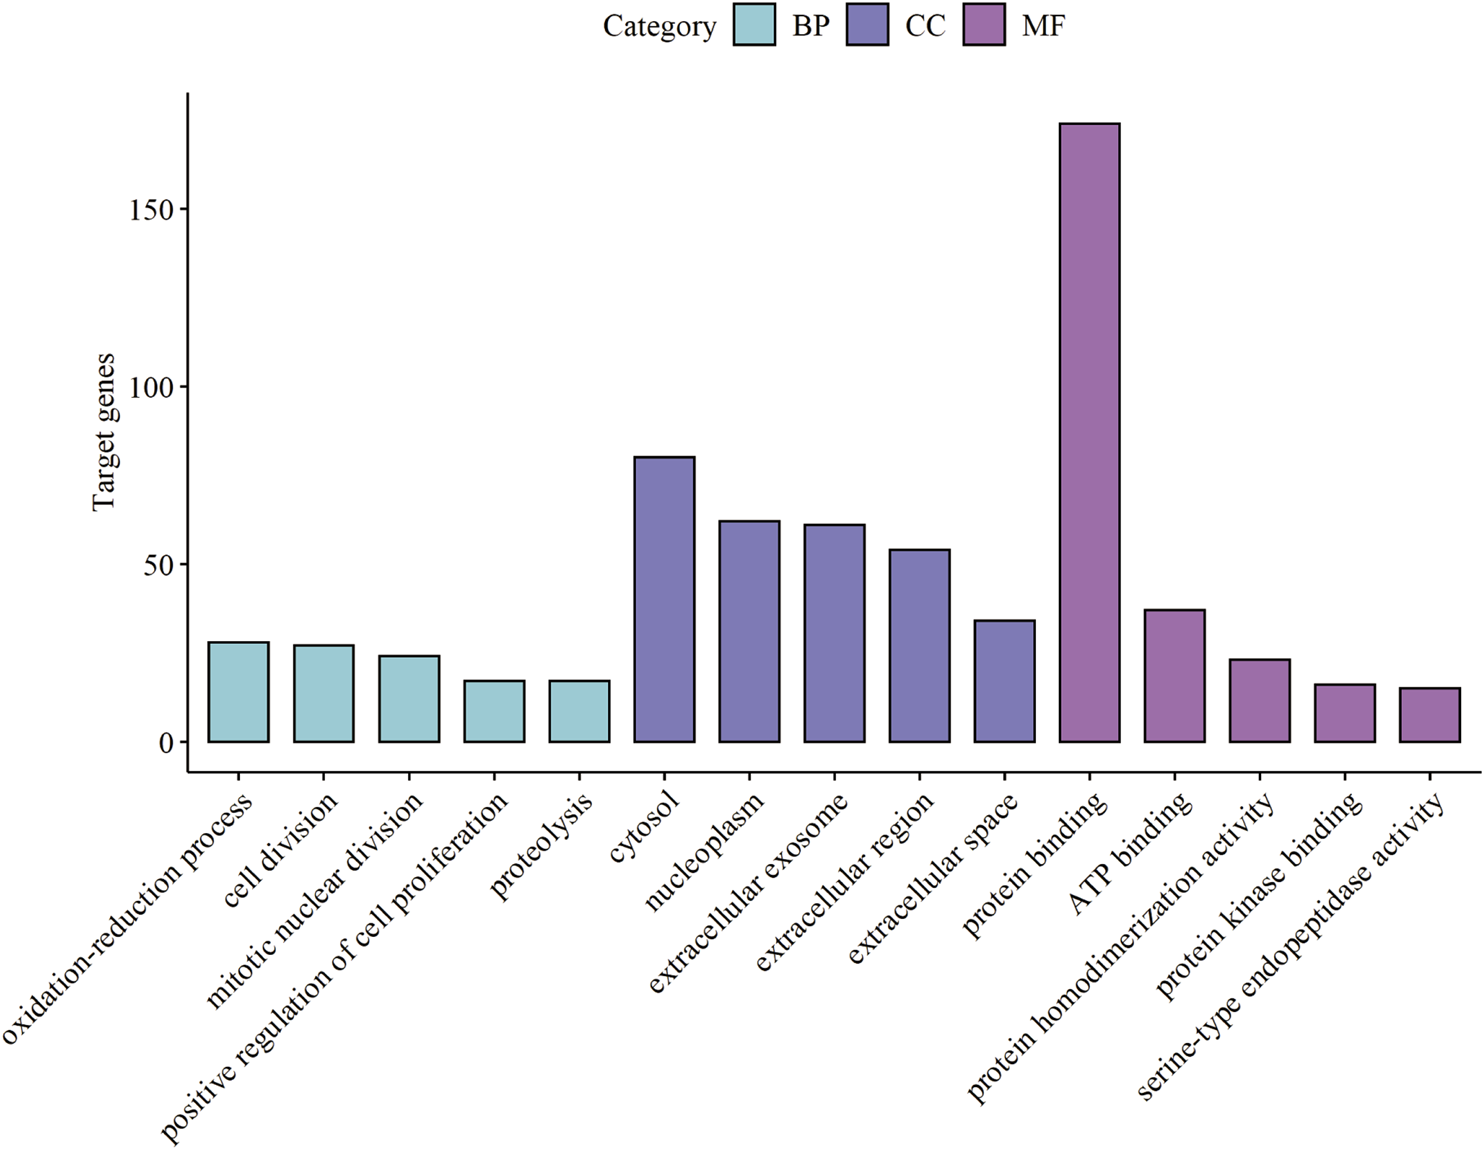
Top 15 GO enrichment terms of the common DEGs. Biological Process (BP), Cellular Component (CC), and Molecular Function (MF) category are represented by sky blue, dark blue, and purple bars, respectively. GO, Gene Ontology. DEGs, differentially expressed genes.
FIGURE 4
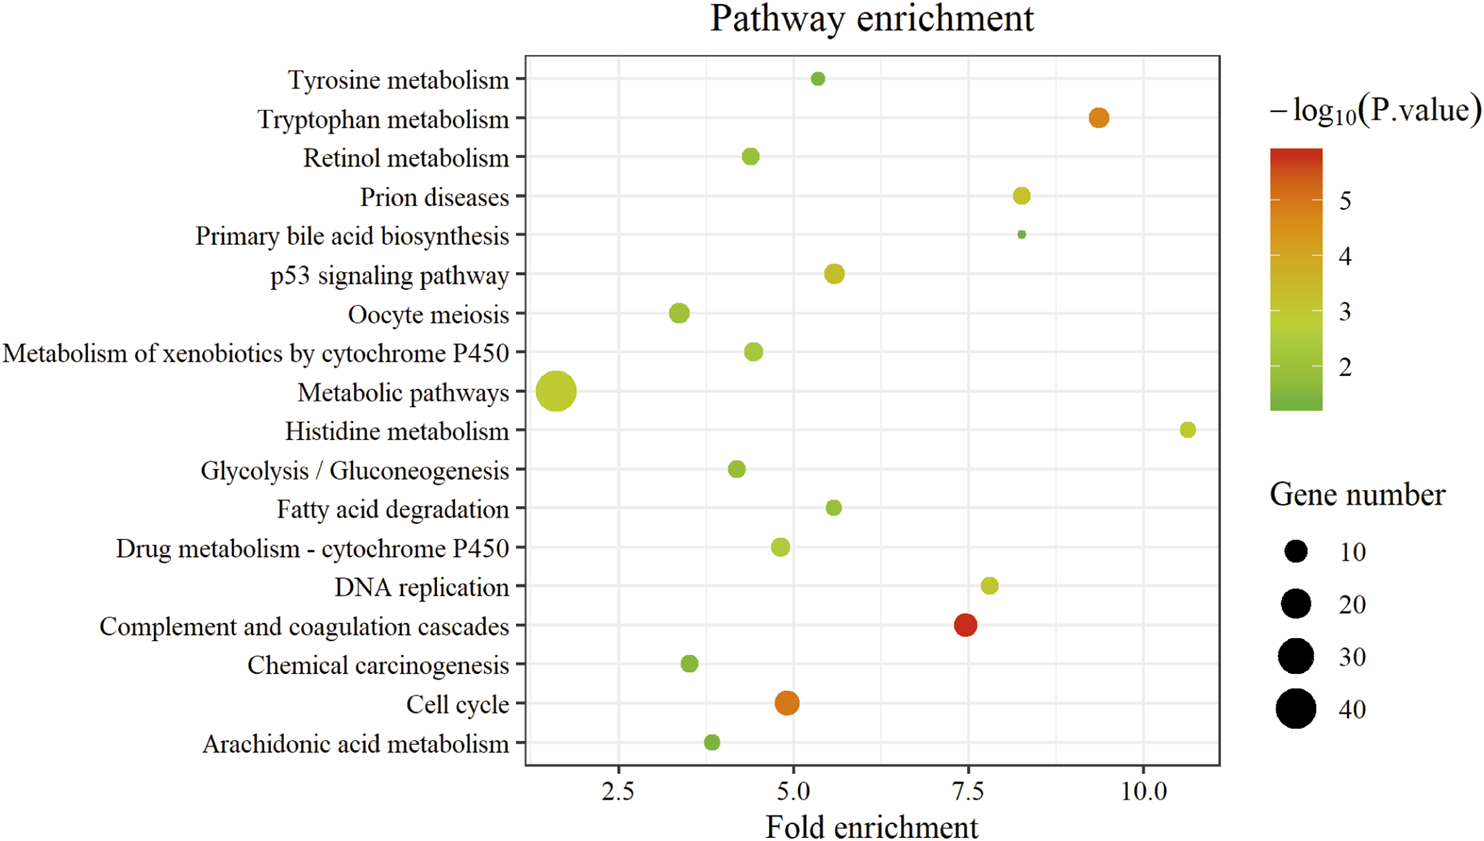
The KEGG pathway of the common DEGs. The abscissa represents the fold enrichment; the ordinate represents the pathway terms. The size of bubble represents gene number enriched in this pathway, and the color of bubble represents statistical difference. KEGG, Kyoto Encyclopedia of Genes and Genomes. DEGs, differentially expressed genes.
Protein-Protein Interaction Network Construction and Subnetwork Analysis
The PPI network was initially constructed by importing the 293 common DEGs from four microarray datasets about HCC in China into the STRING online database (Supplementary Figure S5). Next, the network diagram was presented by using Cytoscape, which was composed of 253 nodes and 3113 edges, as shown in Figure 5A. Furthermore, the three most significant subnetworks (Figures 5B–D, Supplementary Table S5) of the PPI network were selected. The results of KEGG analysis showed that the genes in subnetwork 1 were particularly enriched in cell cycle, DNA replication, p53 signaling pathway, oocyte meiosis, viral carcinogenesis, and progesterone-mediated oocyte maturation; subnetwork 2 was principally enriched in complement and coagulation cascades and prion diseases; and the subnetwork 3 was mainly enriched in metabolic pathways, drug metabolism - cytochrome P450, linoleic acid metabolism, arachidonic acid metabolism, and metabolism of xenobiotics by cytochrome P450 and retinol metabolism, as shown in Supplementary Table S6 and Supplementary Figure S6.
FIGURE 5
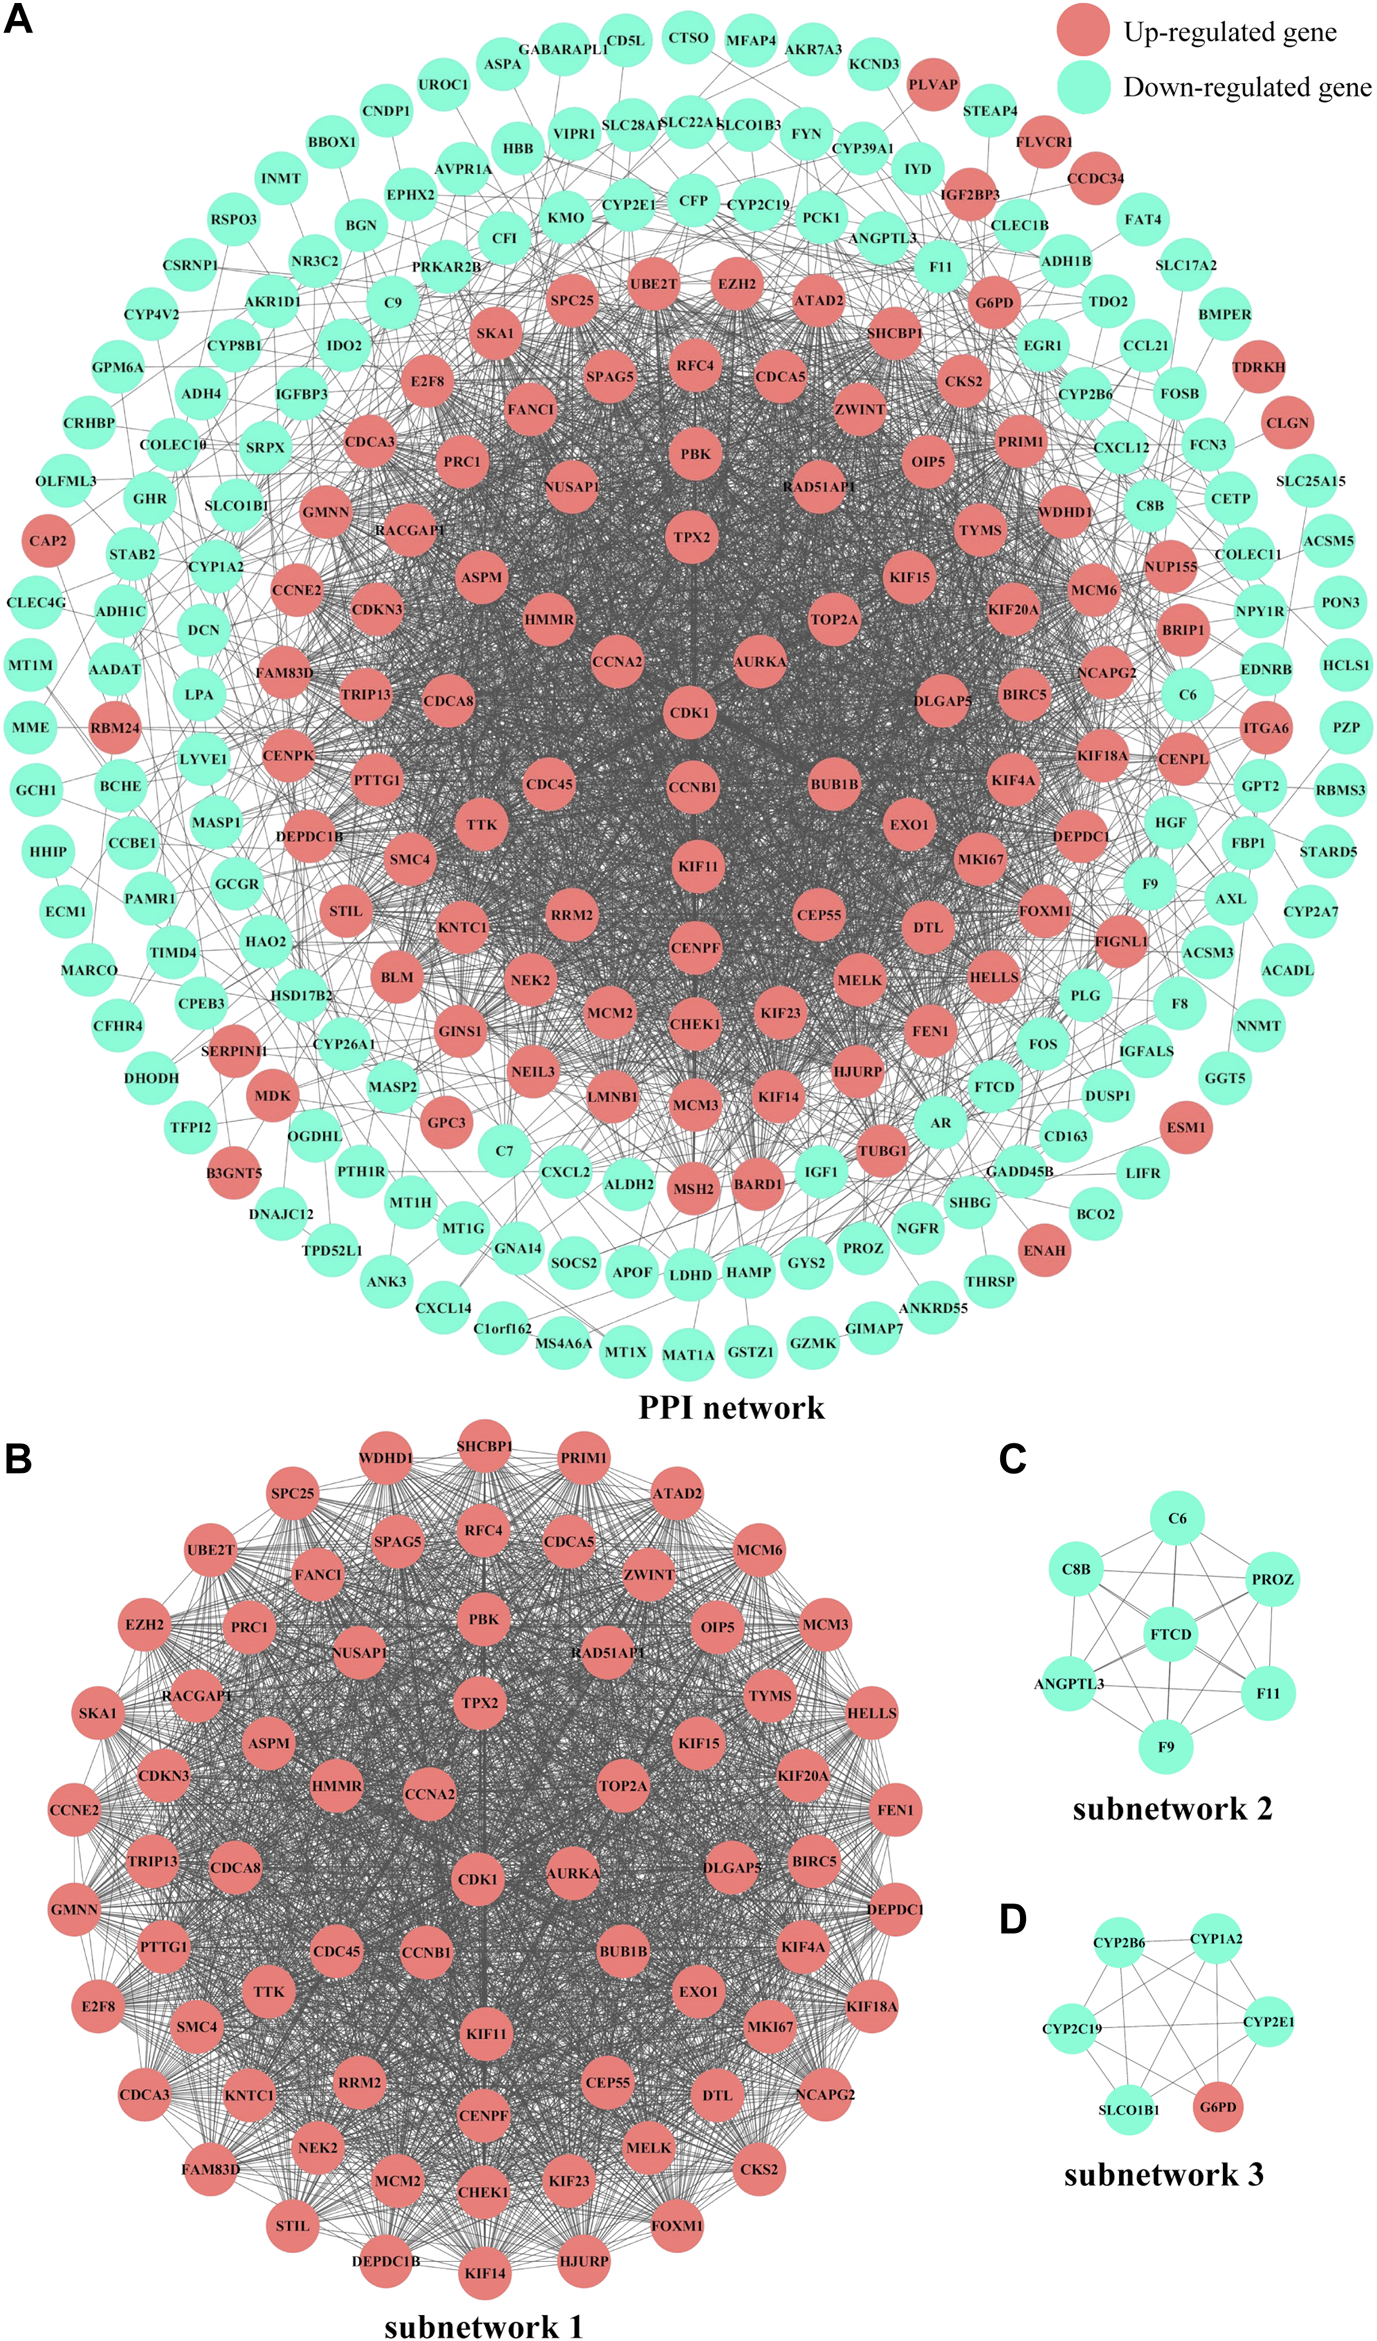
PPI network diagrams of common DEGs and subnetworks from the Cytoscape software. (A)PPI network of common DEGs. (B)subnetwork 1, MCODE score = 65.493. (C)subnetwork 2, MCODE score = 7. (D)subnetwork 3, MCODE score = 5.6. Red nodes and blue nodes represent upregulated genes and downregulated genes, respectively. PPI, protein-protein interaction. DEGs, differentially expressed genes.
Hub Genes Identification and Prognosis Analysis
The top 10 hub genes with high degree identified by using CytoHubba, included CDK1 (Cyclin-dependent kinase 1), CCNB1 (cyclin-B1), AURKA (Aurora kinase A), CCNA2 (Cyclin-A2), KIF11 (kinesin family member 11), BUB1B (mitotic checkpoint serine/threonine kinase B), TOP2A (DNA topoisomerase II alpha), TPX2 (Xenopus kinesin-like protein 2), HMMR (Hyaluronan mediated motility receptor) and CDC45 (cell division cycle 45) (Figures 6A,B and Table 2). In addition, the selected hub genes were highly expressed in HCC tumor tissues compared with normal tissues of the TCGA dataset in GEPIA (Figures 7A–J), which is consistent with our results.
FIGURE 6
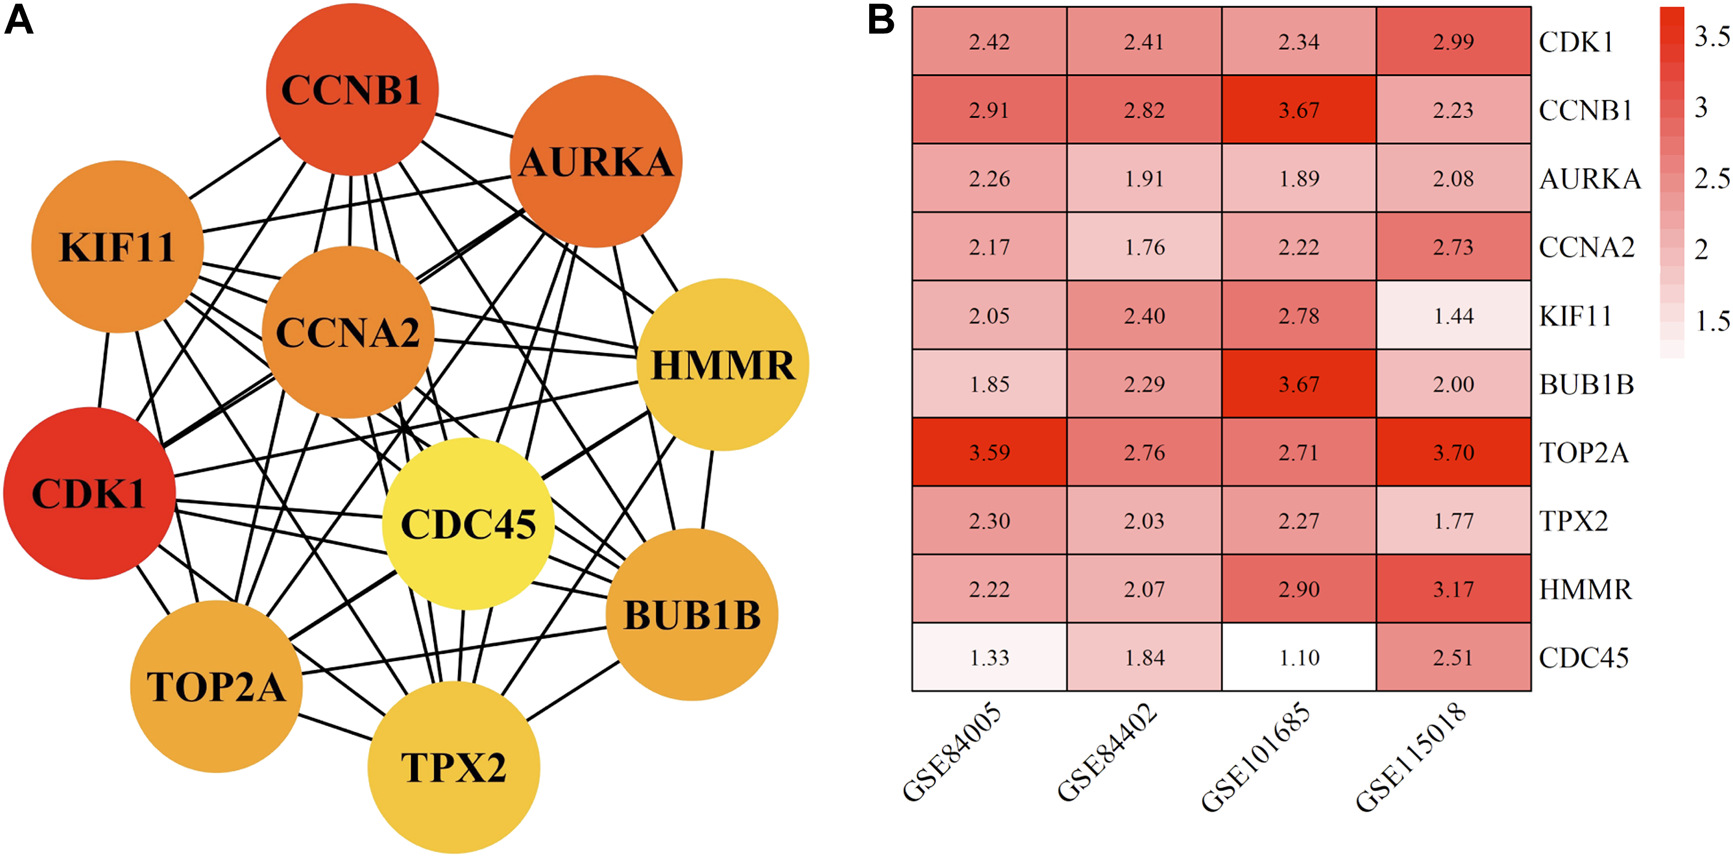
The top ten hub genes of HCC in China. (A) shows the interaction network interaction between hub genes. (B) shows differential expression of ten hub genes in different datasets. The abscissa represents the GEO accessions; the ordinate represents the gene name, the value in the box represents the log FC value. HCC, hepatocellular carcinoma. FC, fold change.
TABLE 2
| Gene | Description | Degree | Related signal pathway | Up/down |
|---|---|---|---|---|
| CDK1 | cyclin-dependent kinase 1 | 88 | Cell cycle, p53 signaling pathway, Oocyte meiosis | Up |
| CCNB1 | cyclin-B1 | 86 | Cell cycle, p53 signaling pathway, Oocyte meiosis | Up |
| AURKA | Aurora kinase A | 83 | Oocyte meiosis | Up |
| CCNA2 | cyclin-A2 | 82 | Cell cycle | Up |
| KIF11 | kinesin family member 11 | 82 | Not mention | Up |
| BUB1B | mitotic checkpoint serine/threonine kinase B | 81 | Cell cycle | Up |
| TOP2A | DNA topoisomerase II alpha | 81 | Not mention | Up |
| TPX2 | Xenopus kinesin-like protein 2 | 80 | Unknown | Up |
| HMMR | Hyaluronan mediated motility receptor | 80 | Not mention | Up |
| CDC45 | cell division cycle 45 | 79 | Cell cycle | Up |
The top 10 genes with the highest degree between HCC tissues and normal liver tissues.
HCC, hepatocellular carcinoma.
FIGURE 7
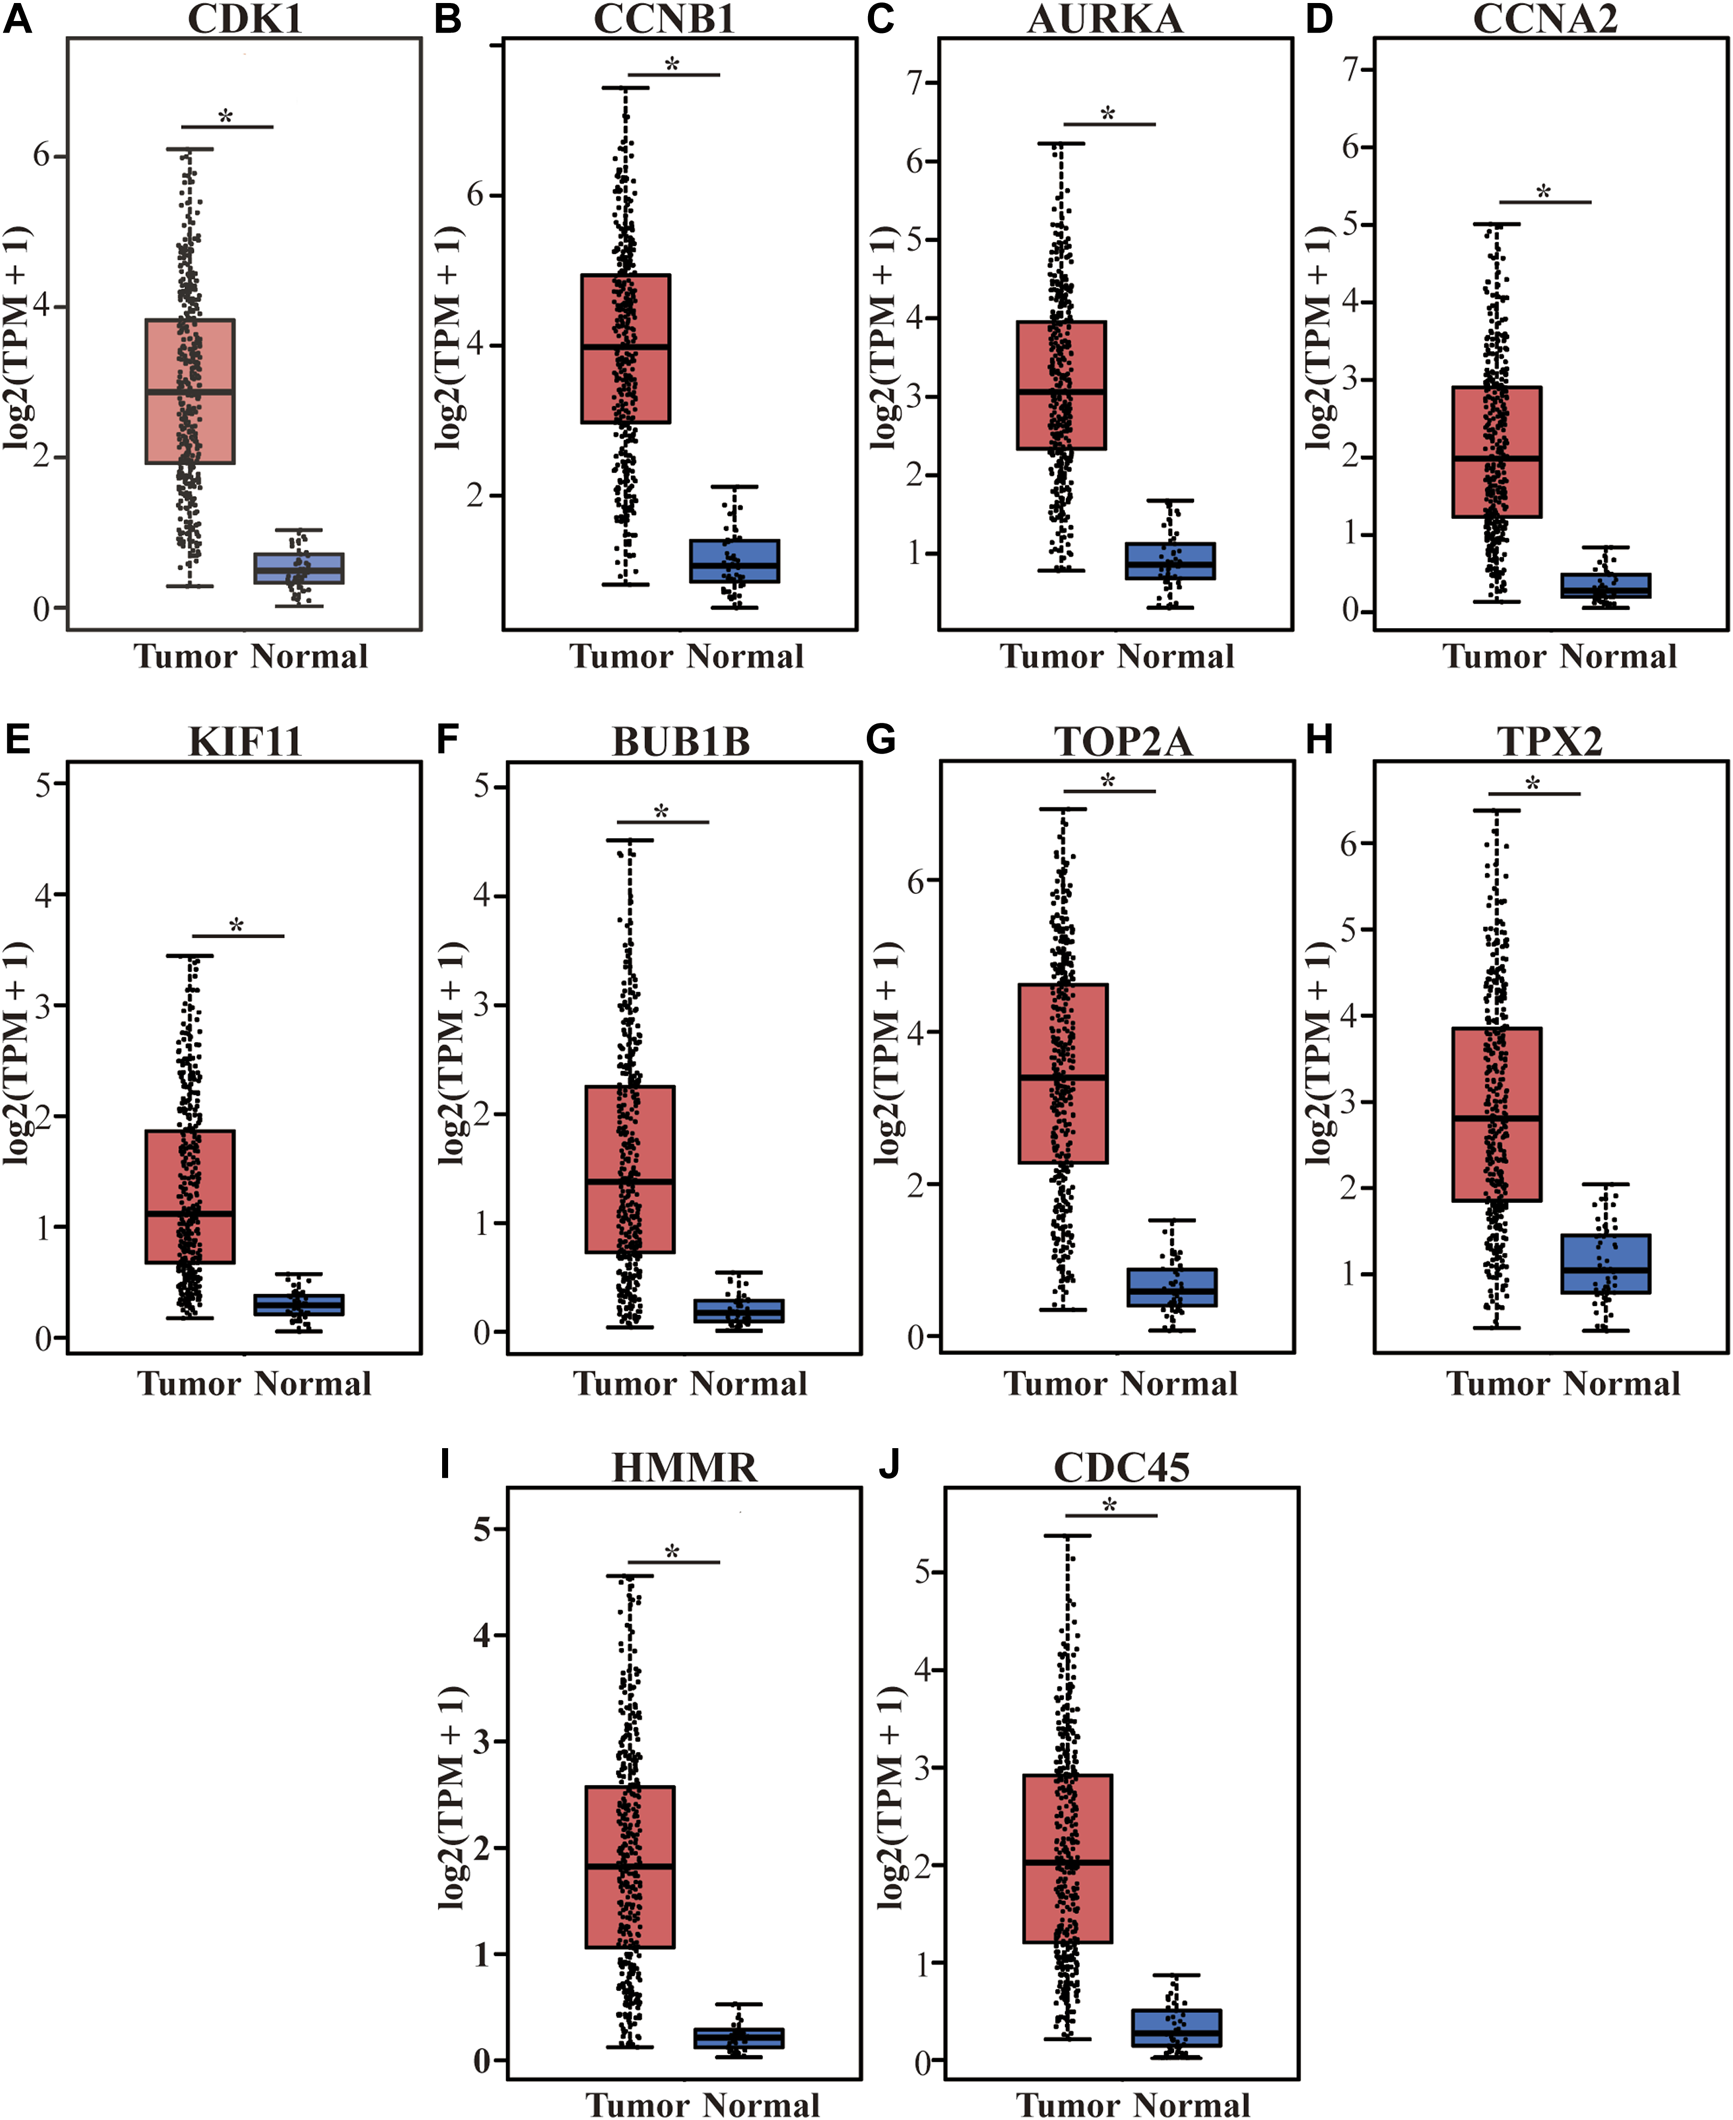
Differential expression of the top 10 hub genes on the TCGA LIHC dataset in the GEPIA database. (A–J) represent CDK1, CCNB1, AURKA, CCNA2, KIF11, BUB1B, TOP2A, TPX2, HMMR and CDC45. The red boxes represent tumor tissues group, and the blue boxes represent normal tissue group. *p < 0.001. TCGA, The Cancer Genome Atlas, LIHC, liver hepatocellular carcinoma, TPM, Trans Per Million.
To further explore the hub genes protein expression in HCC, we analyzed immunohistochemistry staining images about CDK1 (five samples), CCNB1(seven samples), AURKA (seven samples), CCNA2(six samples), KIF11(6 samples), BUB1B(none), TOP2A (7 samples), TPX2 (6 samples), HMMR (3 samples) and CDC45 (8 samples) in HCC tissues and normal tissues from the HPA(Figure 8). The result showed that the protein expression level of CDK1 and TOP2A was negative in normal tissues and positive in HCC tissues. Moreover, the low protein expression levels of TPX2 were revealed in normal liver tissues, while low (1/6) and medium (4/6) even none (1/6) protein expression levels were observed in liver cancer tissues. Besides, the protein expression level of CCNA2 was negative in normal tissues and half of HCC samples (3/6). CCNB1 proteins were not expressed in normal tissues, while medium protein expressions of CCNB1 were expressed in most HCC samples (5/7). Also, medium protein expressions of KIF11 were observed in normal breast tissues, while medium (3/6) and high (3/6) protein expressions in HCC tissues. Furthermore, AURKA, HMMR, and CDC45 proteins were not expressed in normal and most HCC samples (4/7, 2/3, 6/8). In summary, compared with normal tissue, the above results indicated that translational expression levels of CDK1 and TOP2A were overexpressed in HCC.
FIGURE 8
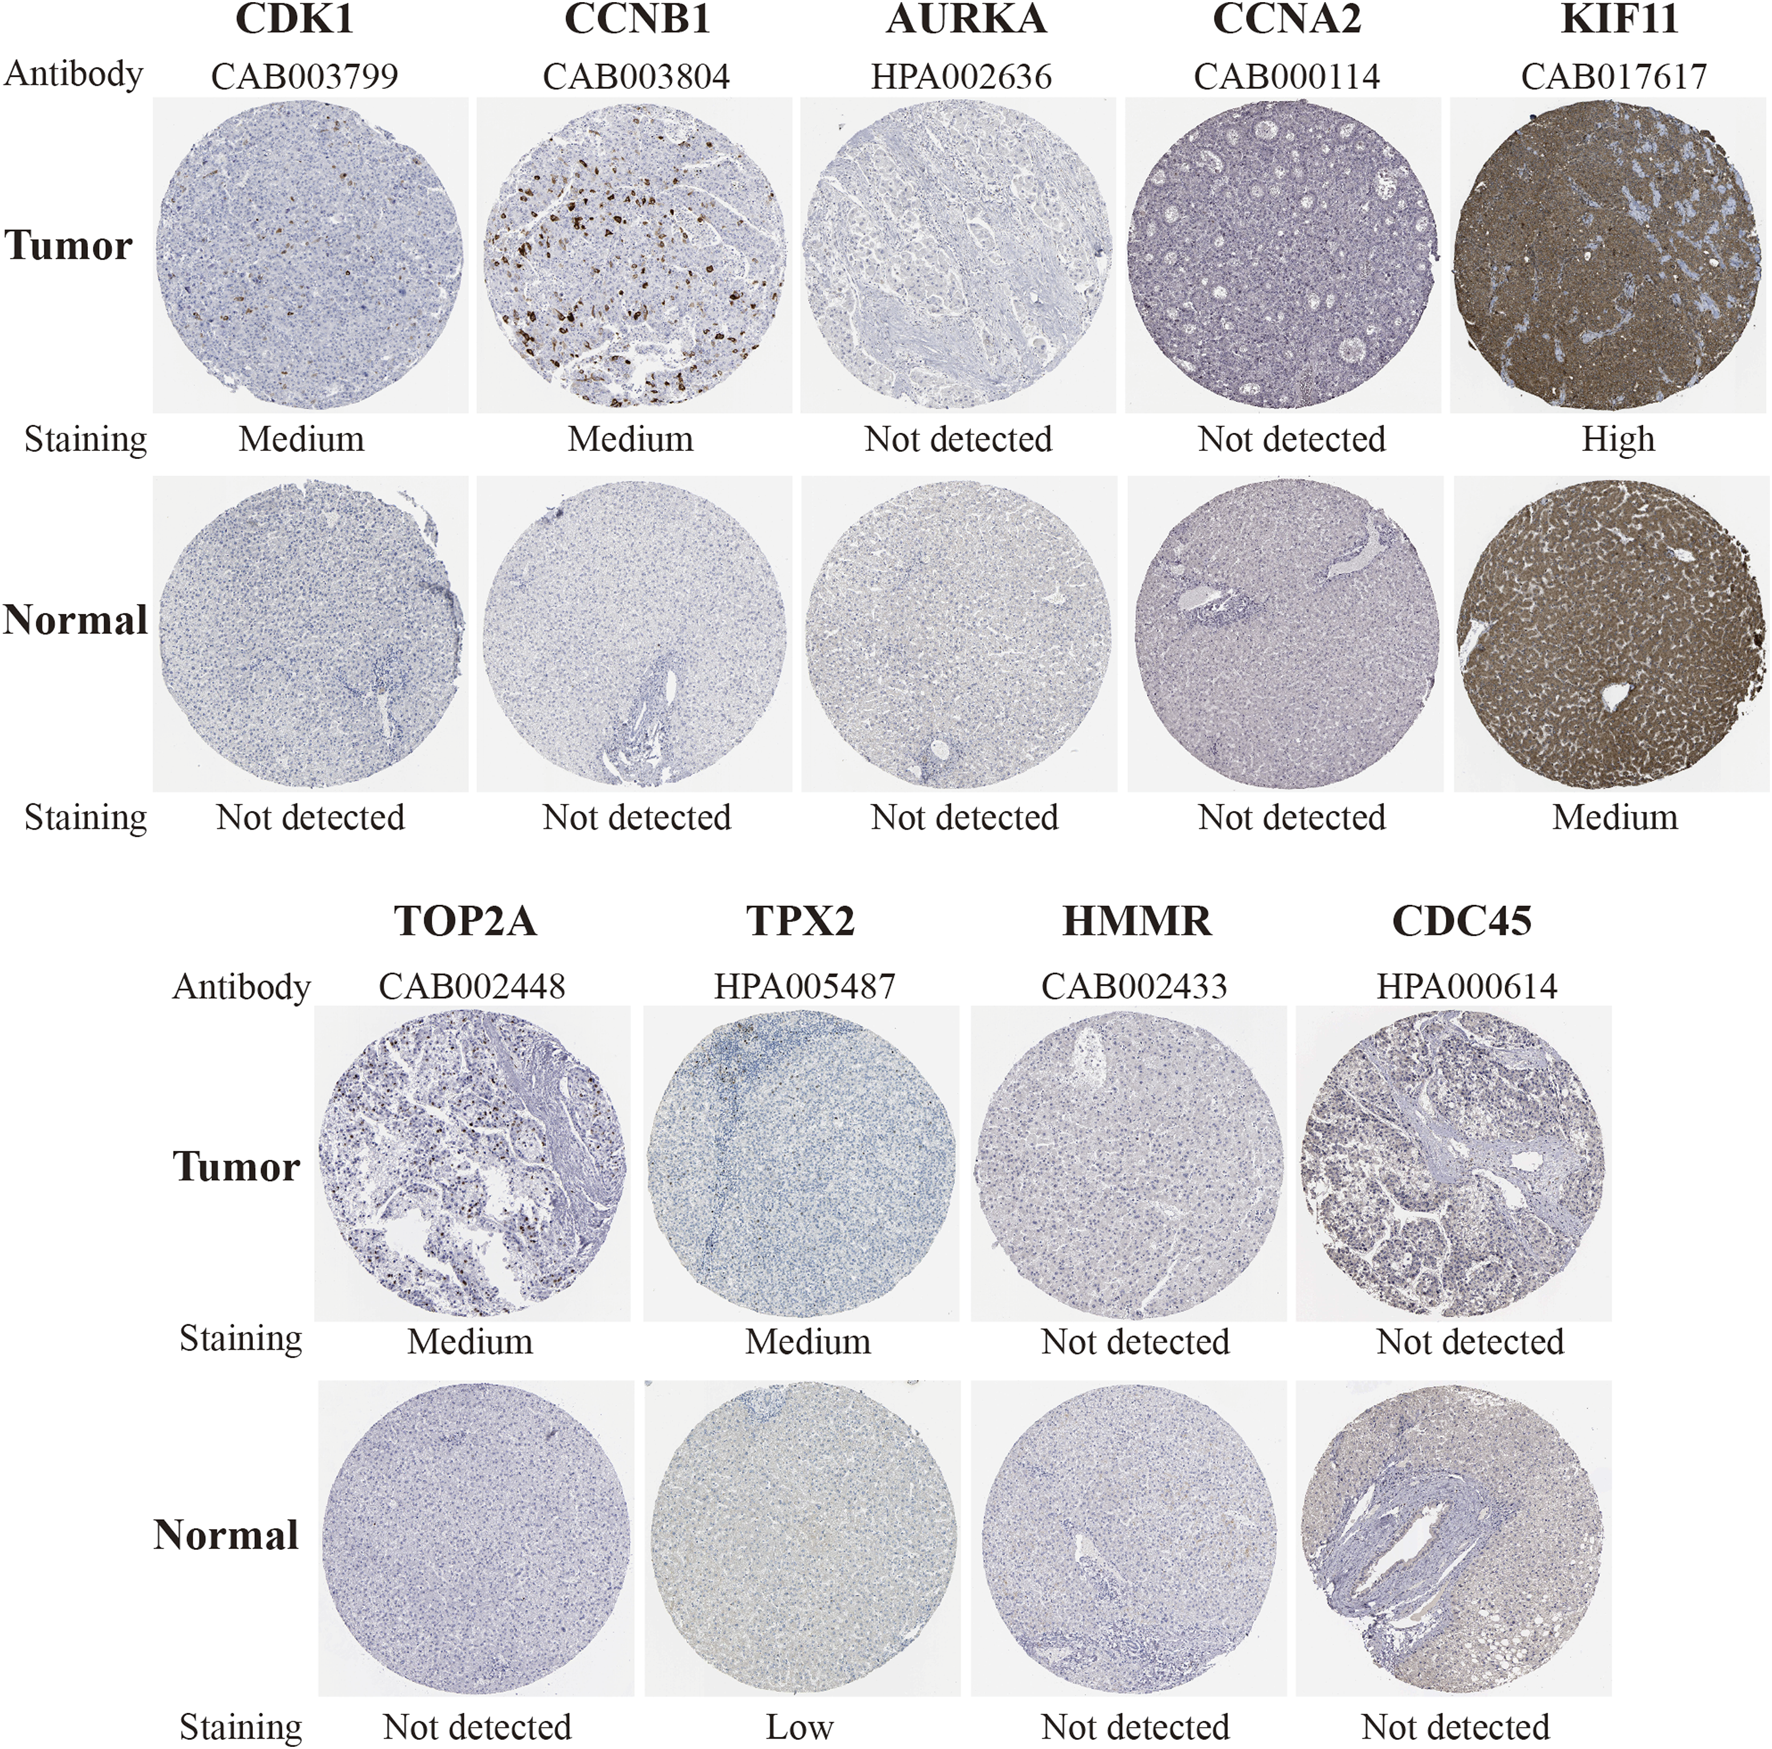
Immunohistochemical staining of protein level of candidate genes (CDK1, CCNB1, AURKA, CCNA2, KIF11, TOP2A, TPX2, HMMR and CDC45) in normal tissues and HCC tissues in the HPA database. The result of BUB1B was missing. HCC, hepatocellular carcinoma, HPA, Human Protein Atlas.
As is shown in Figures 9A–J, Over-expression of CDK1 (p < 0.0001), CCNB1 (p < 0.0001), AURKA (p = 0.0016), CCNA2 (p = 0.00055), KIF11 (p < 0.0001), BUB1B (p = 0.00087), TOP2A (p = 0.00031), TPX2 (p < 0.0001), HMMR (p < 0.0001) and CDC45 (p < 0.0001) was associated with poor overall survival (OS) among TCGA HCC patients in UALCAN. Furthermore, we conducted a subgroup analysis of HCC patients by ethnicity using Kaplan-Meier Plotter. In general, high expression of all ten genes was associated with poor prognosis, which is consistent with previous results. In Asian cohort, Over-expression of CDK1 (hazard ratio [HR], 4.95; p = 4.7E-08), CCNB1 (HR, 7.09; p = 6.3E-09, AURKA (HR, 4.5; p = 9.6E-07), CCNA2 (HR, 5.27; p = 7.3E-07), KIF11 (HR, 4.47; p = 1.3E-07), BUB1B (HR, 4.85; p = 2.4E-08), TOP2A (HR, 5.07; p = 7.5E-09), TPX2 (HR, 5.95; p = 1.5E-10), HMMR (HR, 4.72; p = 2.9E-07) and CDC45 (HR, 3.94; p = 1.6E-06) was associated with poor OS. Significantly, compared with White/Caucasian cohort, overexpression of hub genes in the Asian cohort predicted poorer survival outcomes (Table 3). This shows the potential of these genes as prognostic markers for HCC in Asia (including China).
FIGURE 9
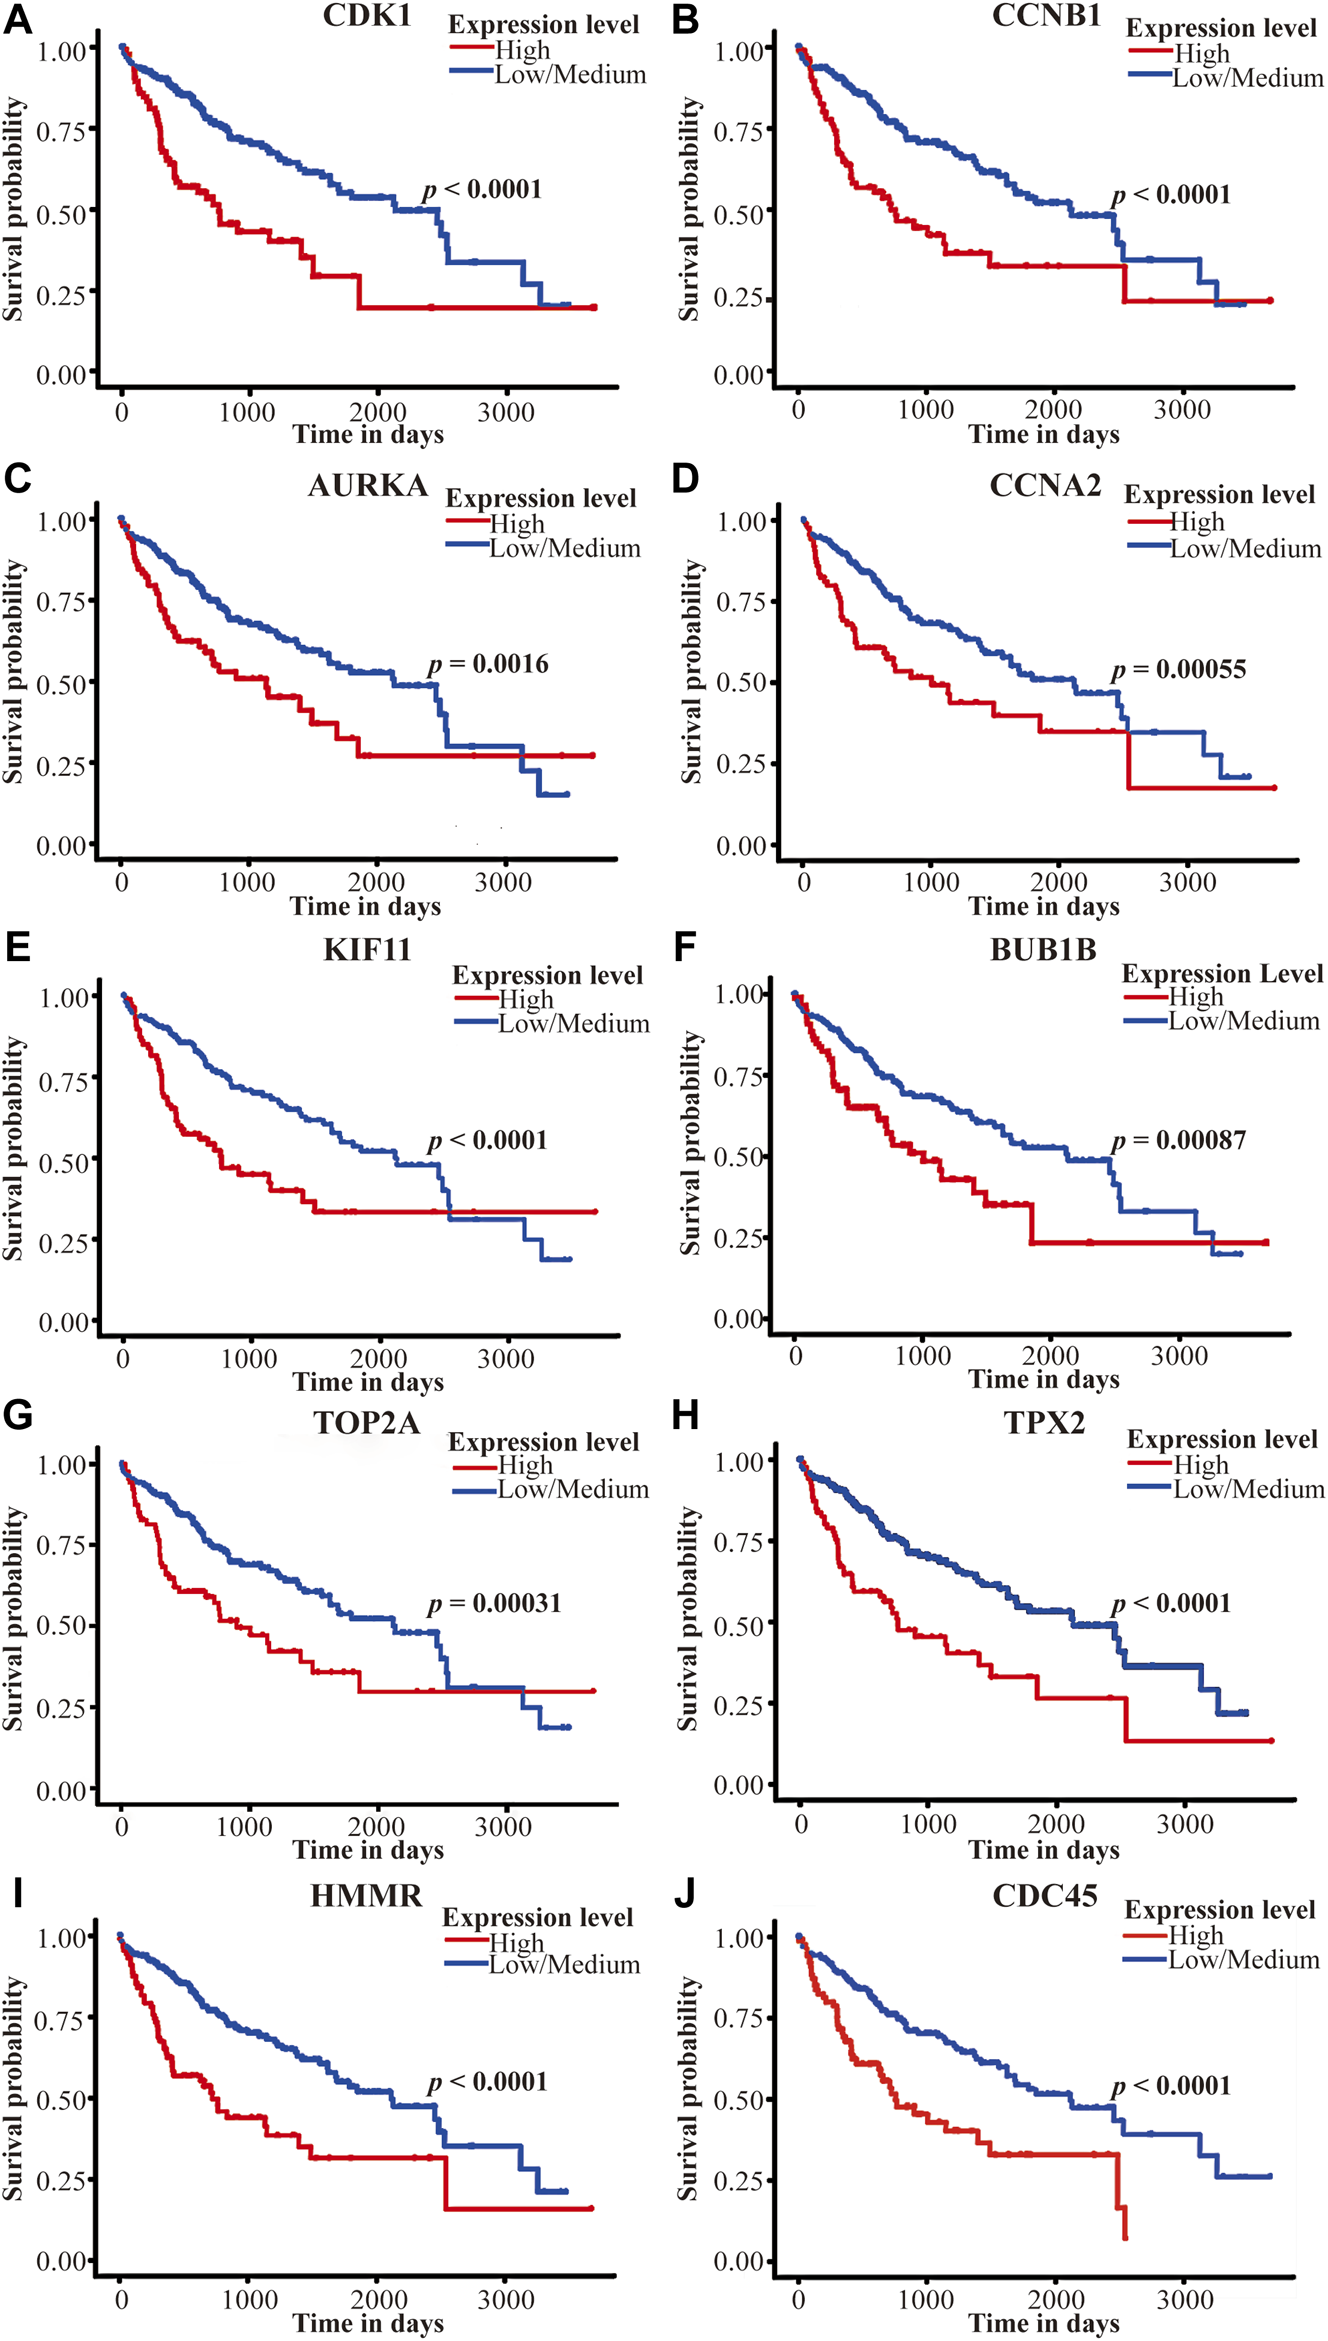
Survival analysis of the top 10 hub genes on the TCGA LIHC dataset in the UALCAN database. (A–J) represent CDK1, CCNB1, AURKA, CCNA2, KIF11, BUB1B, TOP2A, TPX2, HMMR, and CDC45. The red line represents the high-expression group, and the blue line represents the low/medium-expression group. p Value <0.05 was considered statistically significant. TCGA, The Cancer Genome Atlas, LIHC, liver hepatocellular carcinoma.
TABLE 3
| Gene | All (N = 364) | White (N = 184) | Asian (N = 158) | |||
|---|---|---|---|---|---|---|
| HR (95%CI) | p.Value | HR (95%CI) | p.Value | HR (95%CI) | p.Value | |
| CDK1 | 2.15 (1.52–3.06) | 1.1E–05 | 1.62 (1.01–2.59) | 0.042 | 4.95 (2.63–9.32) | 4.7E–08 |
| CCNB1 | 2.34 (1.55–3.54) | 3.4E–05 | 1.8 (1.1–2.94) | 0.018 | 7.09 (3.29–15.29) | 6.3E–09 |
| AURKA | 1.77 (1.25–2.5) | 0.0011 | 1.34 (0.84–2.15) | 0.22 | 4.5 (2.33–8.66) | 9.6E–07 |
| CCNA2 | 1.91 (1.36–2.72) | 0.00018 | 1.9 (1.02–3.52) | 0.039 | 5.27 (2.53–10.98) | 7.3E–07 |
| KIF11 | 2.02 (1.42–2.85) | 5.5E–05 | 1.77 (1.11–2.82) | 0.014 | 4.47 (2.44–8.2) | 1.3E–07 |
| BUB1B | 2.01 (1.42–2.86) | 6.6E–05 | 1.73 (1.01–2.96) | 0.042 | 4.85 (2.64–8.92) | 2.4E–08 |
| TOP2A | 1.99 (1.39–2.86) | 0.00012 | 2.09 (1.17–3.76) | 0.012 | 5.07 (2.76–9.33) | 7.5E–09 |
| TPX2 | 2.29 (1.62–3.24) | 1.4E–06 | 2.54 (1.34–4.84) | 0.0032 | 5.95 (3.21–11.02) | 1.5E–10 |
| HMMR | 2.29 (1.62–3.24) | 1.3E–06 | 2.43 (1.45–4.08) | 0.00055 | 4.72 (2.46–9.05) | 2.9E–07 |
| CDC45 | 2.23 (1.51–3.28) | 3.4E–05 | 1.59 (0.99–2.55) | 0.053 | 3.94 (2.16–7.19) | 1.6E–06 |
Survival for the ten hub genes in the Asian and White/Caucasian HCC cohorts from TCGA in Kaplan-Meier Plotter.
HCC, hepatocellular carcinoma; TCGA, The Cancer Genome Atlas; HR, Hazard Ratio; CI, confidence interval.
Discussion
In the present study, A total of 293 common DEGs, including 103 up-regulated genes and 190 down-regulated genes, were identified in HCC tissues compared with normal hepatic tissues. Interestingly, as shown in the PPI network, most of the genes with higher connectivity were up-regulated genes, which were mainly enriched in cell cycle, cell division, and mitotic nuclear division. It suggested that common DEGs participate in the proliferation and division of HCC cells. The common DEGs and subnetworks were associated with signaling pathways such as metabolic pathways and cell cycle. Under the regulation of various carcinogenic pathways, cancer cells undergo adaptive metabolic reprogramming to maintain a specific metabolic state that supports their uncontrolled proliferation [20]. The latest research first used integrated proteogenomic characterization of paired tumor and adjacent liver tissues to reveal liver-specific metabolic reprogramming in HBV-related HCC [21]. Also, given the evidence that the epidemics of obesity, diabetes, and metabolic syndrome were considered as contributory factors to the occurrence of HCC [1, 5], the changes in metabolic pathways are not only the result of the progression of HCC but also may engage in the development of HCC. The recovery of abnormal metabolism provides a new idea for prevention, diagnosis, and treatment of HCC in China. The 10 hub genes were identified in the PPI network, including CDK1, CCNB1, AURKA, CCNA2, KIF11, BUB1B, TOP2A, TPX2, HMMR and CDC45. Although the critical genes screened are not the same in many earlier reports, these studies with similar results show that cell cycle and metabolic pathways play an essential role in the occurrence and development of liver cancer [22–24].
Moreover, all of the hub genes’ over-expression was related to poor prognosis in the TCGA database. Interestingly, compared with White group, the Asian group’s overexpression predicted poorer survival outcomes in Kaplan-Meier Plotter. This shows the potential of these genes as prognostic markers for HCC in Asia (including China). This may contribute to discovering biomarkers and drug targets for HCC in China that guide clinical practice and benefit patients.
It is widely believed that the cell cycle is closely linked with the advancement of cancers, while the disruption of the cell cycle is a characteristic of tumor cells. In this study, thirteen common DEGs containing half of ten hub genes, including CCNB1, CDK1, CDC45, BUB1B and CCNA2, enriched in the cell cycle. This result suggests that cell cycle plays a vital role in the development of HCC and provides new targets for identifying serological markers and therapies of HCC in China. Cyclins and cyclin-dependent protein kinases (CDKs) are important regulators for cell cycle progression [25]. CCNB1, usually called cyclin B1, is a key regulator of G2/M in the cell cycle [26]. Some studies have found that CCNB1 expression is increased in different types of cancer, such as breast cancer [27] and gastric cancer [28]. CDK1 is a member of serine/threonine protein kinases, which forms a complex with CCNB1 to regulate the mitotic process and maintain the mitotic state [29]. It has been reported that CDK1 is not only overexpressed in diffuse large B-cell lymphoma and melanoma but also highly expressed in colorectal cancer and prostate cancer [30]. Previous studies have shown that CDK1/CCNB1 inhibits the p53 signaling pathway and regulate the development of HCC [8]. An in vitro study demonstrated that HBV X protein (HBx) induces G2/M phase arrest and apoptosis through continuous activation of CDK1/CCNB1 kinase [31]. Other studies reported that both CCNB1 and CDK1 are overexpressed in HBV-related HCC tissues and are associated with poor survival [26].
CCNA2, usually called cyclin A2, binds and activates cyclin-dependent kinase 2 and promotes transition through G1/S and G2/M in the cell cycle. Some studies have implied that CCNA2 is overexpressed in many types of cancers [32]. Other studies have revealed that CCNA2 is overexpressed in HCC and may be relevant to poor prognosis [33], supporting our results. HBV integration is common in HBV-related HCC and may play an important role in the occurrence and development of HCC. In 1990, the study of Wang et al. first reported the integration of CCNA2 gene and hepatitis B virus in HCC [34]. Recent studies have demonstrated that adeno-associated virus type 2 (AAV2) infection induces insertion mutations in tumors. CCNA2, as one of the insertion target genes of AAV2, is overexpressed in HCC, promoting cell cycle progression and showing its potential carcinogenic function [35]. Recently, Bayard et al. firstly described the recurrent fusion of the CCNA2 gene in the non-cirrhotic liver cancer genome, which leads to oncogene activation by truncating a regulatory N-terminal domain [36].
BUB1B encodes a kinase involved in spindle checkpoint function and plays a role in delaying the onset of anaphase and ensuring proper chromosome segregation. Previous studies discovered that over-expression of BUB1B in tumor tissues predicts a poor prognosis of pancreatic ductal adenocarcinoma and adrenal carcinoma, while the low expression of BUB1B is associated with poor survival in patients with colon adenocarcinoma and lung cancer [26]. The up-regulation of BUB1B in tumor tissues of patients with HCC predicts poor OS and relapse-free survival (RFS) [37], which is consistent with our results. Nevertheless, its specific role in the development of HCC is still not completely clear, and further experiments are necessary.
CDC45 (cell division cycle 45) plays a vital role in the initiation and extension of DNA replication in eukaryotic chromosomes [38]. The expression of CDC45 increased in tongue squamous cell carcinomas, and its level was positively correlated with grades of precancerous lesions in epithelial dysplasia [39]. Recently, the overexpression of CDC45 was found to predict poor prognosis in Asian HCC and HBV-related HCC [40, 41], similar to our research results.
In addition to CCNB1, CDK1, CDC45, BUB1B, and CCNA2, we also identified five hub genes in Chinese liver cancer, namely AURKA, KIF11, TOP2A, TPX2, and HMMR, which play a crucial role in regulating the cell cycle. AURKA is a cell cycle-regulated kinase that appears to be involved in microtubule formation and/or stabilization at the spindle pole during chromosome segregation. AURKA plays multiple roles in regulating cancer development, while its oncogenic roles might vary in different types of cancer. In the majority of solid tumors, AURKA works mainly through overriding cell cycle checkpoints and promoting cell cycle progression [42]. Chen et al. found that AURKA is up-regulated in HCC tissues, which is associated with pathological stage and distant metastasis [43]. Interestingly, AURKA is involved in tumor metastasis after radiotherapy for HCC. This is might because AURKA enhances the radiation resistance of HCC by activating the NF-κB signaling pathway [44].
KIF11 encodes a motor protein belonging to the kinesin-like protein family, which is involved in various kinds of spindle dynamics. Previous studies have discovered over-expression of KIF11 in a variety of cancers and suggested poor survival, while another study found that chromosome instability caused by KIF11 silencing or inhibition may contribute to the development of cancers [45]. A study showed that KIF11 overexpression was significantly correlated with HCC progression and prognosis in the TCGA database [46], which is consistent with our results. However, it is necessary to further investigate the function of KIF11 and its exact mechanism in HCC.
TOP2A encodes a DNA topoisomerase, an enzyme that controls and alters the topologic states of DNA during transcription. Among all forms of topoisomerase, TOP2A is mainly involved in cell proliferation and overexpressed in a variety of cancers, and its overexpression causes the poor prognosis of these malignant tumors. In this study, TOP2A was found to be overexpressed in HCC, and its expression levels are positively correlated with poor prognosis, which was consistent with previous research [47]. Previous studies also revealed that TOP2A expression level was closely related to histological grade, microvascular invasion, and early onset. Furthermore, TOP2A was overexpressed in HBV-related HCC, which has close association with serum AFP [48].
TPX2 has been considered as a critical factor in mitosis and spindle assembly due to the Ran-regulated microtubule-associated protein properties and its control of the Aurora-A kinase [49]. It has been reported that TPX2 is overexpressed in many types of cancer, which is correlated with poor prognosis [50]. Our study found that overexpression of TPX2 predicted a poor prognosis of patients with HCC in China. Previous clinical studies have shown that the expression of TPX2 in liver cancer tissue is significantly related to tumor-node-metastasis stage, tumor number, differentiation, and stage [51]. Above all, TPX2 could be a novel prognostic biomarker and a potential therapeutic target for HCC.
HMMR, also known as RHAMM, is one of the few known hyaluronan receptors. However, a recent review indicated that HMMR encodes evolutionarily conserved homeostasis, mitosis, and meiosis regulator instead of a hyaluronan receptor [52]. Additionally, HMMR is decreased in most healthy tissues but increased in hyperplastic tissues. It has been reported that HMMR is overexpressed in HCC tissues compared with normal tissues, and its level is associated with poor prognosis [53], which confirms our results. However, further laboratory experiments are needed to investigate the importance of HMMR in the development of HCC.
Prior to our study, there has been some research on bioinformatics analysis of key genes in HCC [26, 48, 53]. Nevertheless, our study still has several obvious advantages: Firstly, the datasets we selected are from different cities in China. Therefore, the identified genes have unique guiding significance for the early diagnosis and precise treatment of patients with HCC in China. Secondly, the microarray datasets were searched from January 1st, 2016 to October 30th, 2019, to eliminate the errors caused by the imbalance of high-throughput sequencing technology due to the results of some outdated datasets are relatively inaccurate. Thirdly, before identifying DEGs, each dataset’s sample was normalized, which enables accurate comparisons of expression levels between and within samples in this study. Finally, we used the TCGA, HPA, and other databases to verify the results obtained from the GEO database, and the combined use of those databases made the results more convincing than a single database. Unfortunately, our research still has the following deficiencies. Firstly, the four datasets we selected contain only 144 samples and cover four big densely populated cities in China. Secondly, our results were only based on the analysis of GEO, TCGA, and other public databases and have not been verified by molecular biology experiments. Thirdly, our study is an integrated analysis of HCC from China, without further subgroup analysis according to different pathogenesis and tumor types. Therefore, in further study, we will enlarge samples and supplement more multi-center clinical data and add some molecular biology experiments if possible.
Conclusion
In summary, this study firstly screened out common DEGs and signaling pathways involved in the occurrence and development of HCC in China, on the basis of integrated bioinformatics analysis. In addition, the present study opened up new horizons for the specific etiology and molecular mechanisms of HCC and provided candidate biomarkers and new therapeutic targets for HCC in China.
Statements
Data availability statement
The datasets presented in this study can be found in online repositories. The names of the repository/repositories and accession number(s) can be found in the article/Supplementary Material.
Author contributions
PZ conceived and designed the experiments, analyzed the data, prepared figures and tables, drafted and revised the article, and approved the manuscript for publication. JF and YZ contributed to data analysis and revised the manuscript. XW and WC contributed to data interpretation and revised the manuscript. PL provided research direction, conceived and designed the experiments, revised the article, and approved the manuscript for publication.
Conflict of interest
The authors declare that the research was conducted in the absence of any commercial or financial relationships that could be construed as a potential conflict of interest.
Supplementary material
The Supplementary Material for this article can be found online at: https://www.por-journal.com/articles/10.3389/pore.2021.588532/full#supplementary-material.
References
1.
Bray F Ferlay J Soerjomataram I Siegel RL Torre LA Jemal A. Global cancer statistics 2018: GLOBOCAN estimates of incidence and mortality worldwide for 36 cancers in 185 countries. CA Cancer J Clin (2018). 68(6):394–424. 10.3322/caac.21492
2.
Llovet JM Zucman-Rossi J Pikarsky E Sangro B Schwartz M Sherman M et al Hepatocellular carcinoma. Nat Rev Dis Primers (2016). 2:16018. 10.1038/nrdp.2016.18
3.
Zhang BH Yang BH Tang ZY. Randomized controlled trial of screening for hepatocellular carcinoma. J Cancer Res Clin Oncol (2004). 130(7):417–422. 10.1007/s00432-004-0552-0
4.
Guo X Wu J Wei F Ouyang Y Li Q Liu K et al Trends in hepatitis B virus resistance to nucleoside/nucleotide analogues in North China from 2009-2016: a retrospective study. Int J Antimicrob Agents (2018). 52(2):201–209. 10.1016/j.ijantimicag.2018.04.002
5.
Estes C Anstee QM Arias-Loste MT Bantel H Bellentani S Caballeria J et al Modeling NAFLD disease burden in China, France, Germany, Italy, Japan, Spain, United Kingdom, and United States for the period 2016-2030. J Hepatol (2018). 69(4):896–904. 10.1016/j.jhep.2018.05.036
6.
Gershon D. DNA microarrays: more than gene expression. Nature (2005). 437(7062):1195–1198. 10.1038/4371195a
7.
Rung J Brazma A , Reuse of public genome-wide gene expression data. Nat Rev Genet (2013). 14(2):89–99. 10.1038/nrg3394
8.
Qin G Tu X Li H Cao P Chen X Song J et al Long Noncoding RNA p53-stabilizing and activating RNA promotes p53 signaling by inhibiting heterogeneous nuclear ribonucleoprotein K deSUMOylation and suppresses hepatocellular carcinoma. Hepatology (2020). 71(1):112–129. 10.1002/hep.30793
9.
Wang H Huo X Yang XR He J Cheng L Wang N et al STAT3-mediated upregulation of lncRNA HOXD-AS1 as a ceRNA facilitates liver cancer metastasis by regulating SOX4. Mol Cancer (2017). 16(1):136. 10.1186/s12943-017-0680-1
10.
Shi J Ye G Zhao G Wang X Ye C Thammavong K et al Coordinative control of G2/M phase of the cell cycle by non-coding RNAs in hepatocellular carcinoma. PeerJ (2018). 6, e5787. 10.7717/peerj.5787
11.
Huang DW Sherman BT Lempicki RA. Systematic and integrative analysis of large gene lists using DAVID bioinformatics resources. Nat Protoc (2009). 4(1):44–57. 10.1038/nprot.2008.211
12.
Szklarczyk D Gable AL Lyon D Junge A Wyder S Huerta-Cepas J et al STRING v11: protein-protein association networks with increased coverage, supporting functional discovery in genome-wide experimental datasets. Nucleic Acids Res (2019). 47(D1):D607–D613. 10.1093/nar/gky1131
13.
Shannon P Markiel A Ozier O Baliga NS Wang JT Ramage D et al Cytoscape: a software environment for integrated models of biomolecular interaction networks. Genome Res (2003). 13(11):2498–2504. 10.1101/gr.1239303
14.
Bader GD Hogue CW. An automated method for finding molecular complexes in large protein interaction networks. BMC Bioinformatics (2003). 4:2. 10.1186/1471-2105-4-2
15.
Chin CH Chen SH Wu HH Ho CW Ko MT Lin CY. CytoHubba: identifying hub objects and sub-networks from complex interactome. BMC Syst Biol (2014). 8 Suppl 4(Suppl 4):S11. 10.1186/1752-0509-8-s4-s11
16.
Tang Z Li C Kang B Gao G Li C Zhang Z. GEPIA: a web server for cancer and normal gene expression profiling and interactive analyses. Nucleic Acids Res (2017). 45(W1):W98–W102. 10.1093/nar/gkx247
17.
Uhlen M Zhang C Lee S Sjöstedt E Fagerberg L Bidkhori G et al A pathology atlas of the human cancer transcriptome. Science (2017). 357(6352):eaan2507. 10.1126/science.aan2507
18.
Chandrashekar DS Bashel B Balasubramanya SAH Creighton CJ Ponce-Rodriguez I Chakravarthi BVSK et al UALCAN: a Portal for facilitating tumor subgroup gene expression and survival analyses. Neoplasia (2017). 19(8):649–658. 10.1016/j.neo.2017.05.002
19.
Nagy Á Lánczky A Menyhárt O Győrffy B. Validation of miRNA prognostic power in hepatocellular carcinoma using expression data of independent datasets. Sci Rep (2018). 8(1):9227. 10.1038/s41598-018-27521-y
20.
Ding Z Ericksen RE Escande-Beillard N Lee QY Loh A Denil S et al Metabolic pathway analyses identify proline biosynthesis pathway as a promoter of liver tumorigenesis. J Hepatol (2020). 72(4):725–735. 10.1016/j.jhep.2019.10.026
21.
Gao Q Zhu H Dong L Shi W Chen R Song Z et al Integrated proteogenomic characterization of HBV-related hepatocellular carcinoma. Cell (2019). 179(2):561–577. 10.1016/j.cell.2019.08.052
22.
Meng Z Wu J Liu X Zhou W Ni M Liu S et al Identification of potential hub genes associated with the pathogenesis and prognosis of hepatocellular carcinoma via integrated bioinformatics analysis. J Int Med Res (2020). 48(7):300060520910019. 10.1177/0300060520910019
23.
Ji Y Yin Y Zhang W. Integrated bioinformatic analysis identifies networks and promising biomarkers for hepatitis B virus-related hepatocellular carcinoma. Int J Genomics (2020). 2020:2061024. 10.1155/2020/2061024
24.
Zhang L Huang Y Ling J Zhuo W Yu Z Shao M et al Screening and function analysis of hub genes and pathways in hepatocellular carcinoma via bioinformatics approaches. Cancer Biomark (2018). 22(3):511–521. 10.3233/cbm-171160
25.
Roskoski R Jr Cyclin-dependent protein kinase inhibitors including palbociclib as anticancer drugs. Pharmacol Res (2016). 107:249–275. 10.1016/j.phrs.2016.03.012
26.
Zhang X Wang L Yan Y Identification of potential key genes and pathways in hepatitis B virus-associated hepatocellular carcinoma by bioinformatics analyses. Oncol Lett (2020). 19(5):3477–3486. 10.3892/ol.2020.11470
27.
Sabbaghi M Gil-Gómez G Guardia C Servitja S Arpí O García-Alonso S et al Defective cyclin B1 induction in Trastuzumab-emtansine (T-DM1) acquired resistance in HER2-positive breast cancer. Clin Cancer Res (2017). 23(22):7006–7019. 10.1158/1078-0432.Ccr-17-0696
28.
Ding L Yang L He Y Zhu B Ren F Fan X et al CREPT/RPRD1B associates with aurora B to regulate cyclin B1 expression for accelerating the G2/M transition in gastric cancer. Cell Death Dis (2018). 9(12):1172. 10.1038/s41419-018-1211-8
29.
Wu CX Wang XQ Chok SH Man K Tsang SHY Chan ACY et al Blocking CDK1/PDK1/beta-Catenin signaling by CDK1 inhibitor RO3306 increased the efficacy of sorafenib treatment by targeting cancer stem cells in a preclinical model of hepatocellular carcinoma. Theranostics (2018). 8(14):3737–3750. 10.7150/thno.25487
30.
Li L. Huang K. Zhao H. Chen B. Ye Q. Yue J. CDK1-PLK1/SGOL2/ANLN pathway mediating abnormal cell division in cell cycle may be a critical process in hepatocellular carcinoma. Cell Cycle (2020). 19(10):1236–1252. 10.1080/15384101.2020.1749471
31.
Cheng P Li Y Yang L Wen Y Shi W Mao Y et al Hepatitis B virus X protein (HBx) induces G2/M arrest and apoptosis through sustained activation of cyclin B1-CDK1 kinase. Oncol Rep (2009). 22(5):1101–1107. 10.3892/or_00000542
32.
Dong S. Huang F. Zhang H. Chen Q. Overexpression of BUB1B, CCNA2, CDC20, and CDK1 in tumor tissues predicts poor survival in pancreatic ductal adenocarcinoma. Biosci Rep (2019). 39(2):BSR20182306. 10.1042/bsr20182306
33.
Teng L Wang K Liu Y Ma Y Chen W Bi L. Based on integrated bioinformatics analysis identification of biomarkers in hepatocellular carcinoma patients from different regions. Biomed Res Int (2019). 2019:1742341. 10.1155/2019/1742341
34.
Wang J Chenivesse X Henglein B Bréchot C. Hepatitis B virus integration in a cyclin A gene in a hepatocellular carcinoma. Nature (1990). 343(6258):555–557. 10.1038/343555a0
35.
Tatsuno K Midorikawa Y Takayama T Yamamoto S Nagae G Moriyama M et al Impact of AAV2 and hepatitis B virus integration into genome on development of hepatocellular carcinoma in patients with prior hepatitis B virus infection. Clin Cancer Res (2019). 25(20):6217–6227. 10.1158/1078-0432.Ccr-18-4041
36.
Bayard Q Meunier L Peneau C Renault V Shinde J Nault JC et al Cyclin A2/E1 activation defines a hepatocellular carcinoma subclass with a rearrangement signature of replication stress. Nat Commun (2018). 9(1):5235. 10.1038/s41467-018-07552-9
37.
Yang WX Pan YY You CG CDK1, CCNB1, CDC20, BUB1, MAD2L1, MCM3, BUB1B, MCM2, and RFC4 may be potential therapeutic targets for hepatocellular carcinoma using integrated bioinformatic analysis. Biomed Res Int (2019). 2019:1245072. 10.1155/2019/1245072
38.
Broderick R Nasheuer HP Regulation of Cdc45 in the cell cycle and after DNA damage. Biochem Soc Trans (2009). 37(Pt 4):926–930. 10.1042/bst0370926
39.
Li JN Feng CJ Lu YJ Li HJ Tu Z Liao GQ et al mRNA expression of the DNA replication-initiation proteins in epithelial dysplasia and squamous cell carcinoma of the tongue. BMC Cancer (2008). 8:395. 10.1186/1471-2407-8-395
40.
Xiang XH Yang L Zhang X Ma XH Miao RC Gu JX et al Seven-senescence-associated gene signature predicts overall survival for Asian patients with hepatocellular carcinoma. World J Gastroenterol (2019). 25(14):1715–1728. 10.3748/wjg.v25.i14.1715
41.
Xie W Wang B Wang X Hou D Su H Huang H. Nine hub genes related to the prognosis of HBV-positive hepatocellular carcinoma identified by protein interaction analysis. Ann Transl Med (2020). 8(7):478. 10.21037/atm.2020.03.94
42.
Yan M Wang C He B Yang M Tong M Long Z et al Aurora-A kinase: a potent oncogene and target for cancer therapy. Med Res Rev (2016). 36(6):1036–1079. 10.1002/med.21399
43.
Chen C Song G Xiang J Zhang H Zhao S Zhan Y. AURKA promotes cancer metastasis by regulating epithelial-mesenchymal transition and cancer stem cell properties in hepatocellular carcinoma. Biochem Biophys Res Commun (2017). 486(2):514–520. 10.1016/j.bbrc.2017.03.075
44.
Shen ZT Chen Y Huang GC Zhu XX Wang R Chen LB. Aurora-a confers radioresistance in human hepatocellular carcinoma by activating NF-κB signaling pathway. BMC Cancer (2019). 19(1):1075. 10.1186/s12885-019-6312-y
45.
Asbaghi Y Thompson LL Lichtensztejn Z McManus KJ. KIF11 silencing and inhibition induces chromosome instability that may contribute to cancer. Genes Chromosomes Cancer (2017). 56(9):668–680. 10.1002/gcc.22471
46.
Chen J Li S Zhou S Cao S Lou Y Shen H et al Kinesin superfamily protein expression and its association with progression and prognosis in hepatocellular carcinoma. J Cancer Res Ther (2017). 13(4):651–659. 10.4103/jcrt.JCRT_491_17
47.
Shan S Chen W Jia JD. Transcriptome analysis revealed a highly connected gene module associated with cirrhosis to hepatocellular carcinoma development. Front Genet (2019). 10:305. 10.3389/fgene.2019.00305
48.
Chen Z Chen J Huang X Wu Y Huang K Xu W et al Identification of potential key genes for hepatitis B virus-associated hepatocellular carcinoma by bioinformatics analysis. J Comput Biol (2019). 26(5):485–494. 10.1089/cmb.2018.0244
49.
Neumayer G Belzil C Gruss OJ Nguyen MD TPX2: of spindle assembly, DNA damage response, and cancer. Cell Mol Life Sci (2014). 71(16):3027–3047. 10.1007/s00018-014-1582-7
50.
Yang W Wan H Shan R Wen W Li J Luo D et al The clinical significance and prognostic value of Xenopus kinesin-like protein 2 expressions in human tumors: a systematic review and meta-analysis. J Cell Physiol (2019). 234:14991. 10.1002/jcp.28343
51.
Liu Q Tu K Zhang H Zheng X Yao Y Liu Q. TPX2 as a novel prognostic biomarker for hepatocellular carcinoma. Hepatol Res (2015). 45(8):906–918. 10.1111/hepr.12428
52.
He Z Mei L Connell M Maxwell CA. Hyaluronan mediated motility receptor (HMMR) encodes an evolutionarily conserved homeostasis, mitosis, and meiosis regulator rather than a hyaluronan receptor. Cells (2020). 9(4):819. 10.3390/cells9040819
53.
Shen S Kong J Qiu Y Yang X Wang W Yan L. Identification of core genes and outcomes in hepatocellular carcinoma by bioinformatics analysis. J Cell Biochem (2019). 120(6):10069–10081. 10.1002/jcb.28290
Summary
Keywords
China, hepatocellular carcinoma, differentially expressed genes, hub genes, cell cycle, bioinformatics analysis
Citation
Zhang P, Feng J, Wu X, Chu W, Zhang Y and Li P (2021) Bioinformatics Analysis of Candidate Genes and Pathways Related to Hepatocellular Carcinoma in China: A Study Based on Public Databases. Pathol. Oncol. Res. 27:588532. doi: 10.3389/pore.2021.588532
Received
29 July 2020
Accepted
01 February 2021
Published
26 March 2021
Volume
27 - 2021
Edited by
Andrea Ladányi, National Institute of Oncology, Hungary
Updates
Copyright
© 2021 Zhang, Feng, Wu, Chu, Zhang and Li.
This is an open-access article distributed under the terms of the Creative Commons Attribution License (CC BY). The use, distribution or reproduction in other forums is permitted, provided the original author(s) and the copyright owner(s) are credited and that the original publication in this journal is cited, in accordance with accepted academic practice. No use, distribution or reproduction is permitted which does not comply with these terms.
*Correspondence: Ping Li, tjlplxg@163.com
Disclaimer
All claims expressed in this article are solely those of the authors and do not necessarily represent those of their affiliated organizations, or those of the publisher, the editors and the reviewers. Any product that may be evaluated in this article or claim that may be made by its manufacturer is not guaranteed or endorsed by the publisher.