Abstract
Background: Prognostic biomarkers in colorectal carcinoma (CRC) have an important role in therapeutic strategy. Studies have shown that high expression of Aquaporin (AQP) is associated with poor prognosis in a variety of human tumors. AQP is involved in the initiation and development of CRC. The present study aimed to investigate the correlation between the expression of AQP1, 3 and 5 and clinicopathological features or prognosis in CRC.
Methods: The AQP1, 3 and 5 expressions were analyzed based on the immunohistochemical staining of tissue microarray specimens including 112 patients with CRC between June 2006 and November 2008. The expression score of AQP (Allred_score and H_score) was digitally obtained with Qupath software. Patients were divided into high or low expression subgroups based on the optimal cut-off values. The relationship between expression of AQP and clinicopathological characteristics were evaluated using chi-square test, t-test, or one-way ANOVA, when appropriate. Survival analysis of 5-year progression free survival (PFS) and overall survival (OS) was performed with time-dependent ROC, Kaplan-Meier curves, univariate and multivariate COX analysis.
Results: The AQP1, 3 and 5 expressions were associated with regional lymph node metastasis, histological grading, and tumor location in CRC, respectively (p < 0.05). Kaplan-Meier curves showed that patients with high AQP1 expression had worse 5-year PFS than those with low AQP1 expression (Allred_score: 47% vs. 72%, p = 0.015; H_score: 52% vs. 78% p = 0.006), as well as 5-year OS (Allred_score: 51% vs. 75%, p = 0.005; H_score: 56% vs. 80%, p = 0.002). Multivariate Cox regression analysis indicated that AQP1 expression was an independent risk prognostic factor (p = 0.033, HR = 2.274, HR95% CI: 1.069–4.836). There was no significant correlation between the expression of AQP3 and 5 and the prognosis.
Conclusion: The AQP1, 3 and 5 expressions correlate with different clinicopathological characteristics and the AQP1 expression may be a potential biomarker of prognosis in CRC.
Introduction
Colorectal carcinoma (CRC) is the second most deadly cancer and the third most prevalent malignant tumor worldwide [1]. In the past few decades, despite aggressive surgery and advances in chemotherapy, the prognosis for CRC remains unsatisfactory, the 5-year survival rate of CRC patients is still less than 64% [2, 3]. Previous studies have shown that the effectiveness of postoperative chemotherapy and patient survival was closely related to tumor biology [4, 5]. Therefore, the discovery of potential biomarkers is imperative to predict the prognosis of CRC.
Aquaporins (AQPs), a family of transmembrane proteins, are widely distributed on the membrane of nucleated cells. The fluid transfer interceded by AQPs is the primary method for water entry into the cells or outside the cells [6]. At present, it is known that 13 kinds of AQPs can be expressed in humans, of which AQP0, AQP1, AQP2, AQP4, AQP5, AQP6, and AQP8 play a major role in selectively transporting water molecules; AQP3, AQP7, AQP9, and AQP10 can transport glycerol and other small molecular solutes [7], while AQP11 and AQP12 are responsible for the transport of H2O2 in the endoplasmic reticulum [8]. Some clinical studies have indicated that AQPs play an important role in maintaining osmotic pressure, regulating tumor cell migration, cell-matrix adhesion and cell proliferation, and promoting tumor neovascularization [9]. In addition, AQPs have extensive interactions with oncogenes and proteins [10]. Recent research has proved that AQPs were strongly expressed in a variety of human tumors, including, renal cell carcinoma [11], prostate cancer [12], breast cancer [13], pancreatic adenocarcinoma [14], and lung cancer [15].
Although previous studies have confirmed that AQP1 was strongly associated with the prognosis of CRC, a consensus has not been reached until now. Yoshida et al [16] showed that AQP1 was an independent poor prognostic factor for overall survival (OS, p = 0.03). On the contrary, Byung et al [17]found that AQP1 was suggested as not an independent prognostic factor for progression free survival (PFS) and OS. Likewise, Imaizumi et al [18] demonstrated that AQP1 expression was not related to the PFS. In our previous research, we found that the ultra-high b-value DWI could match AQP1 expression of tumor and accordingly speculate AQP1 may be a potential biomarker for prognosis [19]. Up until now, few studies have used two expression scores to evaluate the possible correlation between AQP1, 3 and 5 expression and clinicopathological characteristics or prognosis in CRC. Since the AQPs with high expression in CRC are mainly AQP1, 3 and 5 [20], We therefore hope to determine whether AQP1, 3 and 5 could be used as specific biomarkers indicating that CRC has different clinicopathological features and prognosis.
Materials and methods
Patients
This study was approved by the Ethics Committee of Xijing Hospital and informed consent was acquired for patient specimens and follow-up information. A total of 191 patients with CRC who had undergone surgical resection between June 2006 and November 2008 were investigated and followed up until 2016 in this study. According to the following inclusion and exclusion criteria (Figure 1), the postoperative specimens of 112 patients were involved. The inclusion criteria included: 1) histologically confirmed colorectal adenocarcinoma; 2) age ≥ 18; 3) without other malignant tumors. The exclusion criteria included: 1) non-adenocarcinoma (n = 15); 2) received preoperative anti-tumor therapies (n = 48); 3) follow-up data unavailable (n = 16); 4) unqualified specimens (AQP1, n = 9; AQP3, n = 5; AQP5, n = 3). Lastly, the total number of specimens evaluated for AQP1 expression was 103, AQP3 expression was 107 and AQP5 expression was 109. The main indicators were PFS and OS. PFS was defined as the period of time from the patient’s diagnosis date until any tumor progression, such as metastasis, recurrence, or death. OS was defined as the period of time from the diagnostic date until death from any cause.
FIGURE 1
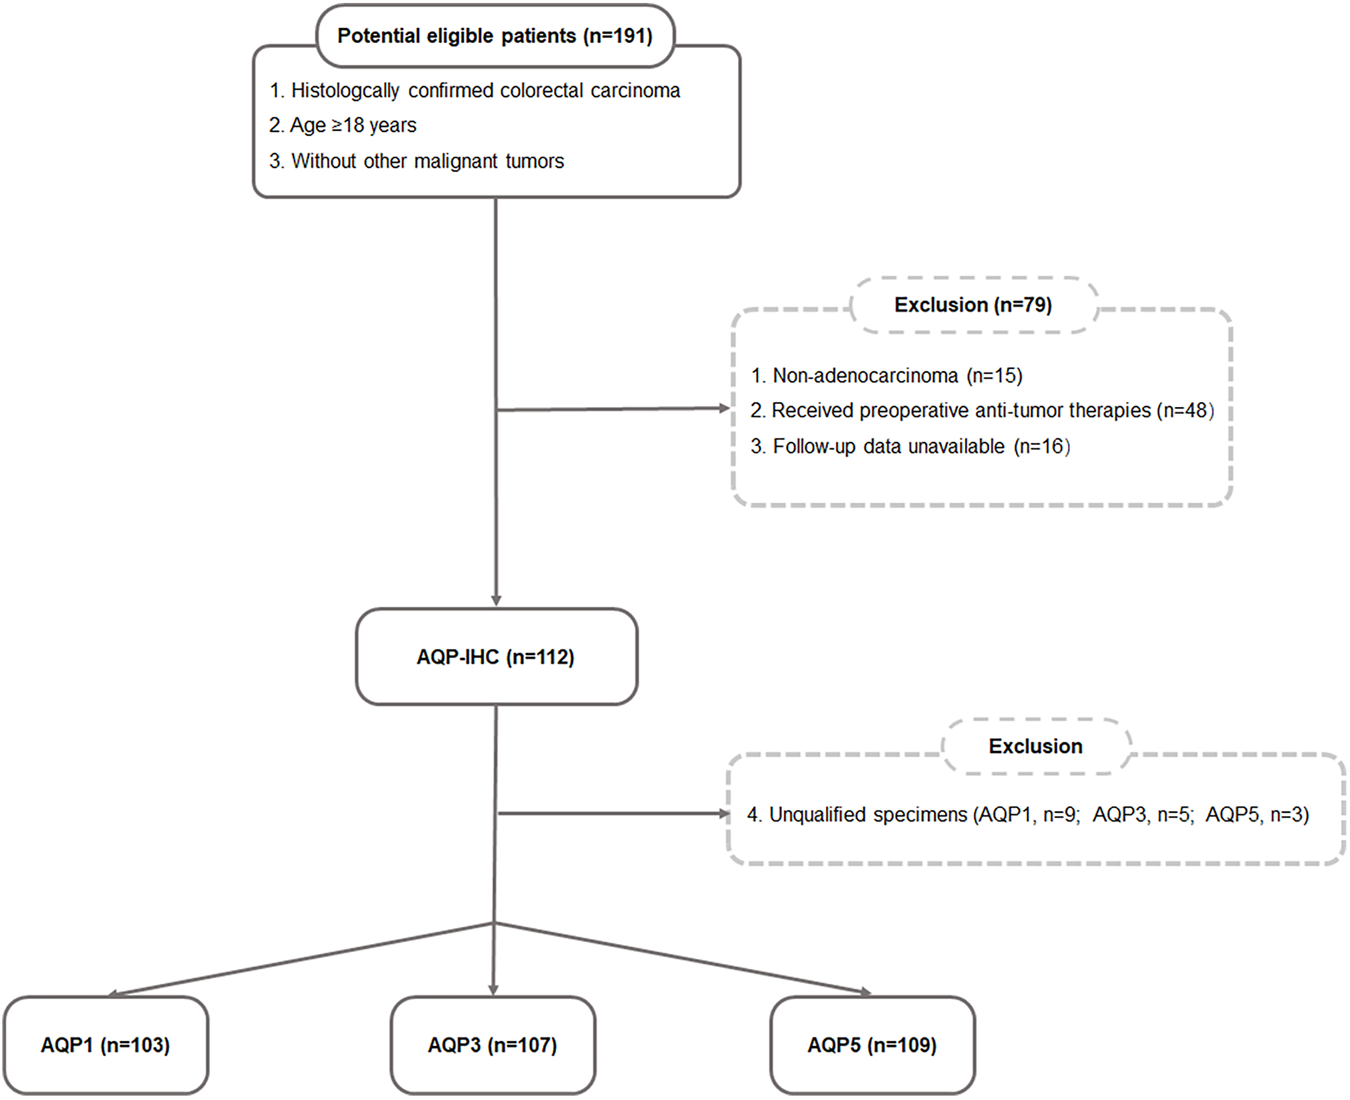
Flow chart of the eligible patient’s selection.
Immunohistochemical staining of AQP1, 3 and 5
Each TMA contained 17 patients’ tissues including 2 cores of tumor tissue and 1 core of paracancerous tissue for one patient. The core diameter of TMA was 1.6 mm. The immunohistochemical staining was performed on a Leica BOND-MAX autoimmunostainer (Leica Instrument Co., Ltd.). The tissue chips were first cut into 4-μm-thick slices using a microtome, attached to slides, dried, and baked at 60°C for 24 h before use. The prepared slices were dewaxed with xylene, rehydrated with different concentrations of ethanol (100% and 95%), rinsed with distilled water, and repaired with heat-induced antigen. Finally, the antigen was detected by an automatic staining machine (Benchmark) and Bond Polymer Purification Detection Kit (LeicaInstrumentCo., Ltd.). The primary antibodies (Abcam) were diluted as follows: anti-AQP1 (ab168387, 1:1,000), anti-AQP3 (ab125219, 1:500), and anti-AQP5 (ab92320, 1:200).
Scoring of AQP immunohistochemical staining
All slides were scanned with a Nano Zoomer SQ (HAMAMATSU, Japan). The expression levels of AQP1, 3 and 5 in the tumor region of each core of TMA were evaluated by Qupath software (Quantitative Pathology, version 0.2.0) and corresponding scores (Allred_score [21]and H_score [22]) were obtained. The average score of two tumor cores from the same patient was submitted for statistical analysis.
The combination of the values for staining intensity and the percentage of positively stained cells produced an Allred score that ranged from 0 to 8. The intensity was given a score between 0 and 3, with 0 representing no staining, 1 representing weak staining, 2 representing moderate staining, and 3 representing high staining Scores representing the proportion of positively stained tumor cells were stratified as 0 (no positive tumor cells), 1 (<1%), 2 (1%–10%), 3 (10%–33%), 4 (33%–67%) and 5 (67%–100%).
The H_score which ranged from 0 to 300 was calculated with the following equation: H_score = ∑ (PI × I) = (percentage of cells with weak intensity × 1) + (percentage of cells with moderate intensity × 2) + (percentage of cells with strong intensity × 3). The terms PI and I in the formula represent the proportion of positive cells to all cells and the staining intensity (0–3), respectively.
Statistical analysis
All analyses were completed using the statistical programming language R (version 4.1.2, 6.1, www.r-project.org) and SPSS (version 26.0, IBM, Armonk, NY). For all statistical tests, differences were considered statistically significant when the p-value was <0.05 (two-tailed).
The correlations between AQP expression and clinicopathological characteristics were investigated with chi-square test, t-test, or one-way ANOVA, when appropriate. The optimal cut-off values of AQP (Allred_score and H_score) to distinguish high AQP1, 3 and 5 expressions from low expression were determined separately using time-dependent ROC curves (R package “survival ROC”). The Kaplan-Meier curves and log-rank tests were used to perform survival analysis of AQP expression by R package “survival.” The Cox proportional hazard regression models were used to conduct both univariate and multivariate survival analyses.
Results
Patient characteristics
A total of 112 patients were eventually enrolled in this retrospective study. The AQP1 group contained 103 consecutive patients (66 males, 37 females; mean age, 59.5 ± 13.4 years; mean follow-up, 78 months, range: 1–128 months). The AQP3 group contained 107 consecutive patients (67 males, 40 females; mean age, 58.8 ± 14.0 years; mean follow-up, 79 months, range: 1–128 months). The AQP5 group contained 109 consecutive patients (68 males, 41 females; mean age, 58.9 ± 14.0 years; mean follow-up, 78 months, range: 1–128 months). The other clinical characteristics of patients were presented in Table 1.
TABLE 1
| Characteristics | AQP1 (n = 103) | AQP3 (n = 107) | AQP5 (n = 109) |
|---|---|---|---|
| Age, years (mean ± SD), n (%) | 59.5 ± 13.4 | 58.8 ± 14.0 | 58.9 ± 14.0 |
| <60 | 50 (48.5%) | 53 (49.5%) | 54 (49.5%) |
| ≥60 | 53 (51.5%) | 54 (50.5%) | 55 (50.5%) |
| Gender, n (%) | |||
| Male | 66 (64.1%) | 67 (62.6%) | 68 (62.4%) |
| Female | 37 (35.9%) | 40 (37.4%) | 41 (37.6%) |
| Primary tumor site, n (%) | |||
| Left colon | 61 (59.2%) | 60 (56.1%) | 62 (56.9%) |
| Right colon | 42 (40.8%) | 47 (43.9%) | 47 (43.1%) |
| Histological grade, n (%) | |||
| Well differentiated | 33 (32.0%) | 35 (32.7%) | 36 (33.0%) |
| Moderate differentiated | 62 (60.2%) | 61 (57.0%) | 62 (56.9%) |
| Poor differentiated | 8 (7.8%) | 11 (10.3%) | 11 (10.1%) |
| TNM stage, n (%) | |||
| I | 22 (21.4%) | 24 (22.4%) | 24 (22.0%) |
| II | 42 (40.8%) | 40 (37.4%) | 42 (38.6%) |
| III | 22 (21.4%) | 25 (23.4%) | 25 (22.9%) |
| IV | 17 (16.5%) | 18 (16.8%) | 18 (16.5%) |
| T stage, n (%) | |||
| T2 | 25 (24.3%) | 27 (25.2%) | 27 (24.8%) |
| T3 | 26 (25.2%) | 27 (25.2%) | 28 (25.7%) |
| T4 | 52 (50.5%) | 53 (49.5%) | 54 (49.5%) |
| N stage, n (%) | |||
| N− | 69 (67%) | 70 (65.4%) | 72 (66.1%) |
| N+ | 34 (33%) | 37 (34.6%) | 37 (33.9%) |
| M stage, n (%) | |||
| M− | 86 (83.5%) | 89 (83.2%) | 91 (83.5%) |
| M+ | 17 (16.5%) | 18 (16.8%) | 18 (16.5%) |
| Treatment strategy, n (%) | |||
| Surgery only | 31 (30.1%) | 33 (30.8%) | 34 (31.2%) |
| Surgery + other treatment | 72 (69.9%) | 74 (69.2%) | 75 (68.8%) |
| Survival rate, n (%) | |||
| 3-year PFS | 68% | 68% | 67% |
| 3-year OS | 70% | 70% | 69% |
| 5-year PFS | 60% | 60% | 59% |
| 5-year OS | 61% | 62% | 61% |
Clinicopathological characteristics of patients in AQP1, 3 and 5 groups.
Abbreviations: PFS, progression free survival; OS, overall survival. The pathological stage was determined by the pathologist according to the 7th edition of AJCC.
Patients were divided into high or low expression subgroups according to the optimal cut-off values (Allred_score and H_score) of AQP1, 3 and 5 expressions which were determined by time-dependent ROC curves according to the 5-year PFS. The optimal cut-off values for AQP1 (Allred_score) and AQP1 (H_score) were 6.0 and 116.17, respectively. The optimal cut-off values for AQP3 (Allred_score) and AQP3 (H_score) were 5.5 and 115.64, respectively. The optimal cut-off values for AQP5 (Allred_score) and AQP5 (H_score) were 6.0 and 18.64, respectively. Accordingly, Immunohistochemical examples of low and high expression of AQP1, 3 and 5 were shown in Figure 2.
FIGURE 2
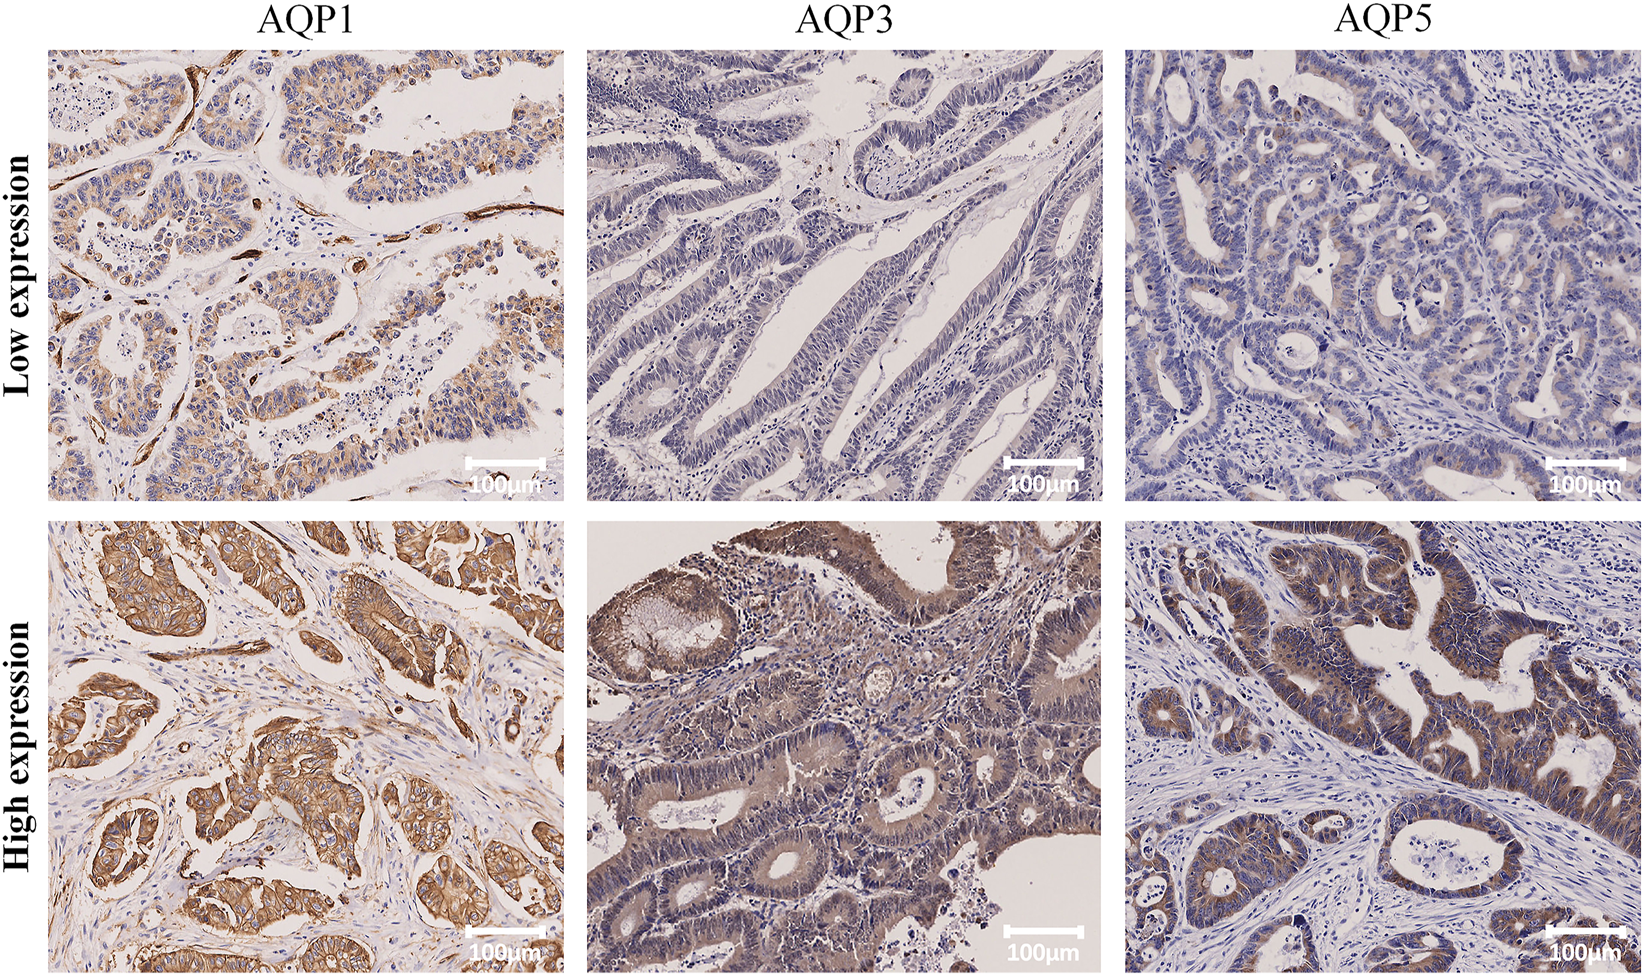
Representative IHC staining of high and low expression of AQP1, AQP3 and AQP5 (×100).
Associations between AQP1, 3 and 5 expressions and clinicopathological characteristics
This study investigated the relationship between AQP1, 3 and 5 expression and gender, age, primary tumor site, histological grading, and TNM stage. For Allred_score, the rate of AQP1 high expression in the positive lymph node group was significantly more common than that in the negative lymph node group (79.4% vs. 58.0%, χ2 = 4.605, p = 0.032, Figure 3). For H_score, the expression of AQP1 was significantly higher in positive lymph node group than that in negative lymph node group (134.81 ± 44.573 vs. 105.978 ± 46.122, t = 3.016, p = 0.003, Figure 4).
FIGURE 3

Percentage bar graph about the correlation between AQP1 (Allred_score) expression and clinicopathological characteristics. The AQP1 expression was significantly correlated with the N stage of CRC (χ2 = 4.605, p = 0.032).
FIGURE 4
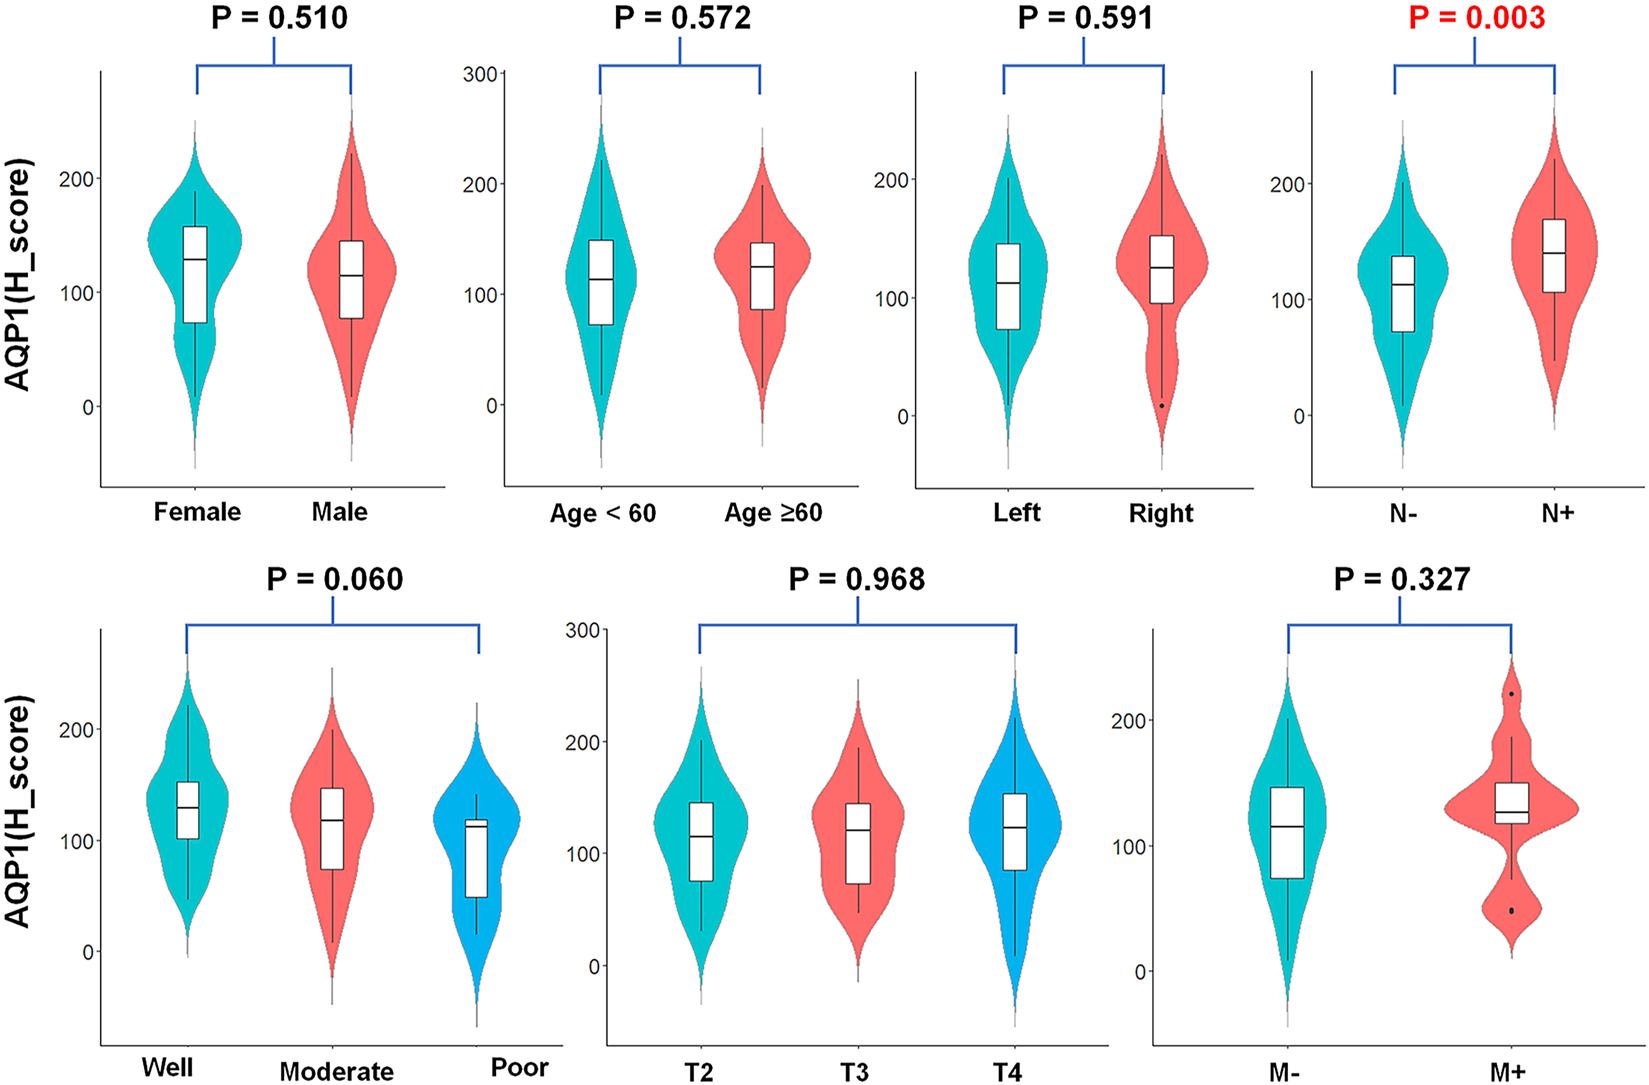
Violin plots about AQP1 (H_score) expression and clinicopathological characteristics. The AQP1 (H_score) expression was significantly correlated with the N stage of CRC (t = 3.016, p = 0.003).
The AQP3(Allred_score) was significantly correlated with the histological grading of CRC. (χ2 = 10.773, p = 0.005, Supplementary Figure S1), AQP3 (H_score) had a similar conclusion (F = 4.212, p = 0.017, Supplementary Figure S2). In multiple comparisons between groups, AQP3 expression (H_score) was found to be significantly higher in well-differentiated group than in moderate-differentiated group (p = 0.005, Supplementary Figure S2), while no statistically significant differences in AQP3 expression were found between the well-differentiated group and poor-differentiated group, as well as moderate-differentiated group and poor-differentiated group (p = 0.233 and 0.542, respectively).
The AQP5 (Allred_score) was apparently associated with the tumor location of colorectal carcinoma (χ2 = 8.123, p = 0.004, Supplementary Figure S3), AQP5 (H_score) had a similar conclusion, resulting in significantly lower AQP5 expression in the left hemicolectomy than in the right hemicolectomy (50.473 ± 54.175 vs. 90.052 ± 62.624, t = −3.531, p = 0.001, Supplementary Figure S4).
Kaplan-Meier survival curves with AQP1, 3 and 5 expressions
Kaplan-Meier survival curves demonstrated that the patient with high expression of the AQP1 had poorer 5-year PFS than patients with low expression of the AQP1 (Allred_score, 5-year PFS = 47% vs. 72%, p = 0.015, Figure 5A; H_score, 5-year PFS = 52% vs. 78%, p = 0.006; Figure 5B). Likewise, the survival rate of patients with high AQP1 expression in 5-year OS was significantly lower compared to that of patients with low AQP1 expression in 5-year OS (Allred_score, 5-year OS = 51% vs. 75%, p = 0.005, Figure 5C; H_score, 5-year OS = 56% vs. 80%, p = 0.002; Figure 5D). However, Kaplan-Meier survival curves presented that the 5-year PFS and OS of patients in high or low AQP3 and 5 expression groups had no statistical difference. (p > 0.05, Supplementary Figures S5, S6).
FIGURE 5
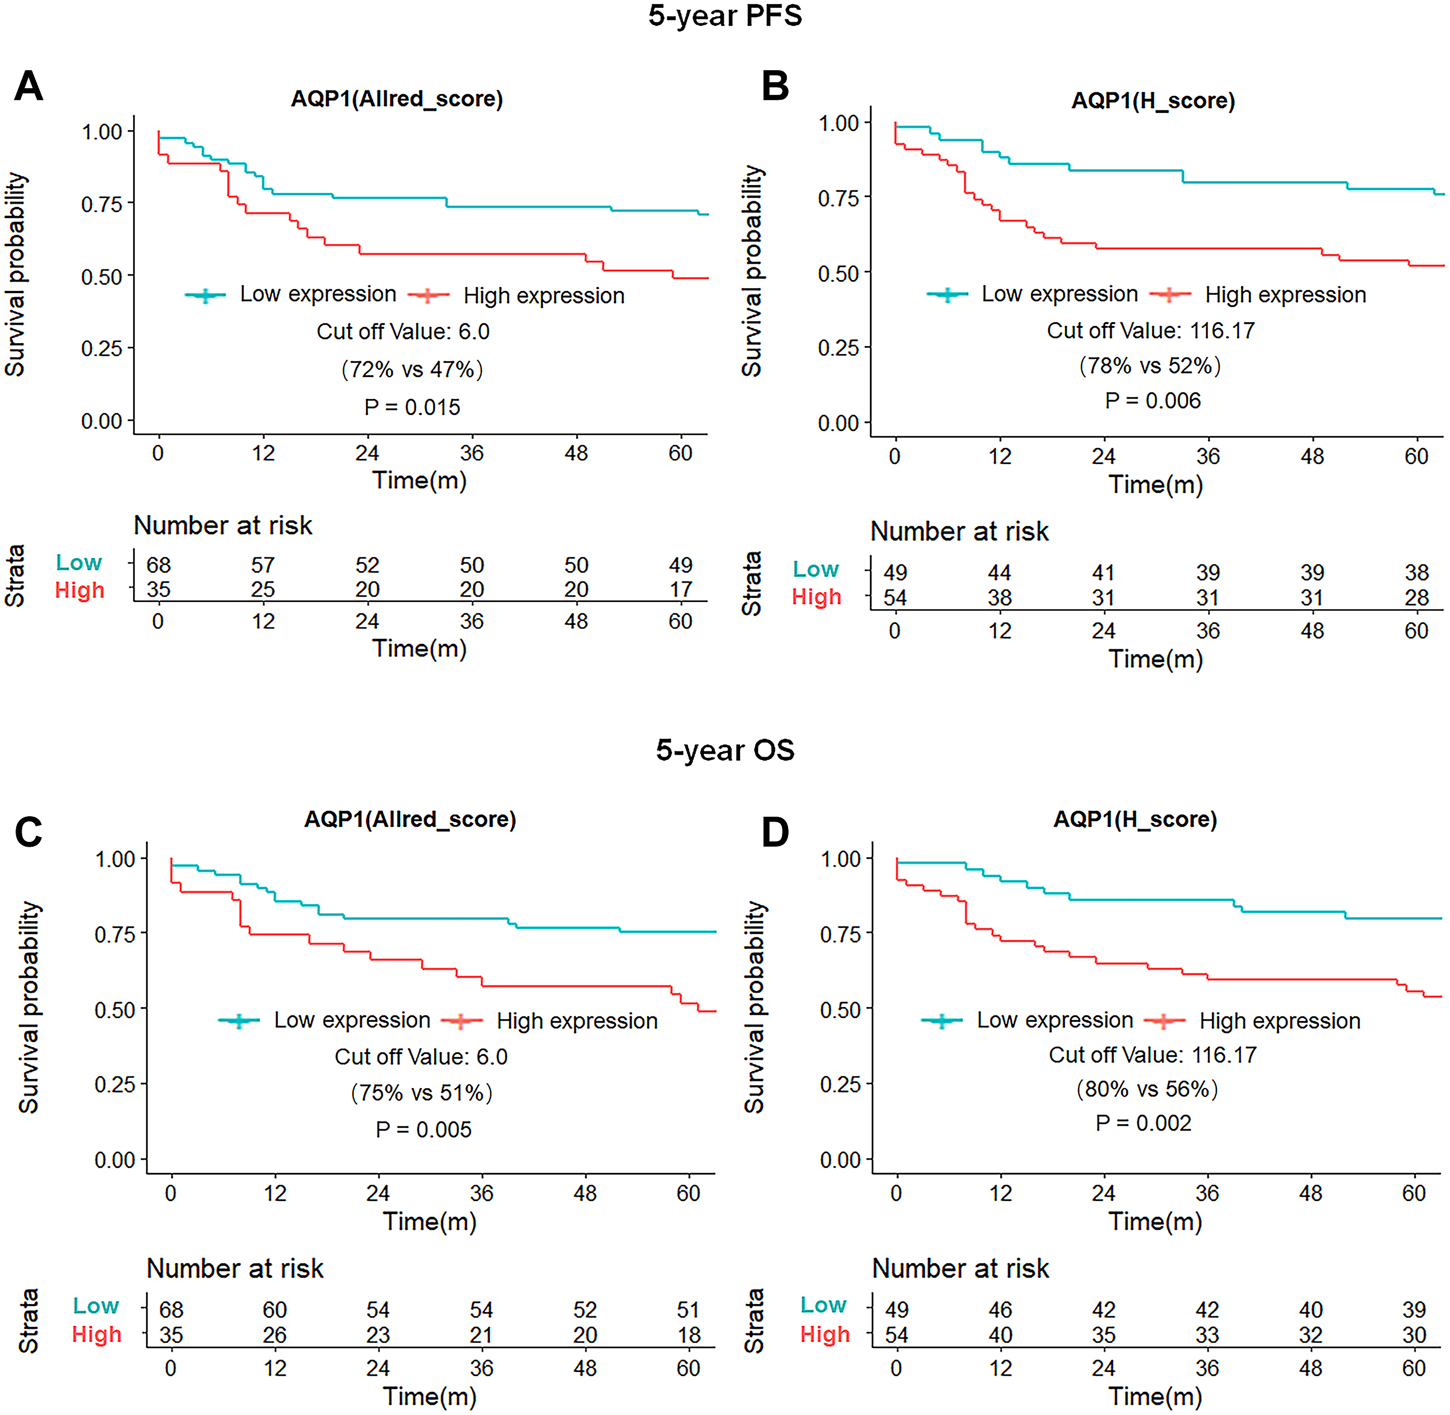
Kaplan-Meier survival curves of 5-year PFS and OS for patients based on AQP1 expression. Patients with high AQP (Allred_score) expression had worse 5-year PFS and OS than those with low AQP (Allred_score) expression [47% vs. 72%, p = 0.015, (A); 51% vs. 75%, p = 0.005; (C)], with similar results for AQP1 (H_score) expression [52% vs. 78%, p = 0.006, (B); 56% vs. 80%, p = 0.002; (D)].
Univariate and multivariate COX regression analysis of the prognosis
The AQP1, 3 and 5 expression and clinicopathologic factors, including age, gender, primary tumor site, histological grading, TNM-stage and treatment strategy, were submitted into univariate and multivariate COX regression analysis. The univariate Cox regression analysis showed that AQP1 (Allred_score and H_score), age, and TNM-stage were risk factors of 5-year PFS and OS for CRC (p < 0.05), while the expression of AQP 3 and AQP5 were not correlated with 5-year PFS and OS (p > 0.05, Table 2).
TABLE 2
| Variate | PFS | OS | ||
|---|---|---|---|---|
| P | HR (95% CI) | P | HR (95% CI) | |
| AQP1 (Allred_score ≥6) | 0.017 | 2.144 (1.143–4.021) | 0.007 | 2.433 (1.276–4.641) |
| AQP3 (Allred_score ≥5.5) | 0.588 | 1.187 (0.638–2.211) | 0.405 | 1.319 (0.688–2.528) |
| AQP5 (Allred_score ≥6) | 0.349 | 1.402 (0.691–2.845) | 0.897 | 1.043 (0.550–1.979) |
| AQP1 (H_score ≥116.17) | 0.008 | 2.532 (1.282–5.004) | 0.003 | 3.041 (1.471–6.288) |
| AQP3 (H_score ≥115.64) | 0.458 | 1.283 (0.664–2.478) | 0.495 | 1.248 (0.660–2.361) |
| AQP5 (H_score ≥18.64) | 0.368 | 1.385 (0.682–2.809) | 0.521 | 1.264 (0.618–2.586) |
| Gender (male) | 0.656 | 0.859 (0.442–0.163) | 0.898 | 0.957 (0.487–1.880) |
| Age (≥60) | 0.042 | 1.971 (1.024–3.794) | 0.030 | 2.115 (1.076–4.157) |
| Primary tumor site (left) | 0.969 | 0.988 (0.522–1.870) | 0.673 | 0.869 (0.454–1.666) |
| Histological grade (low) | 0.475 | 1.219 (0.708–2.100) | 0.213 | 1.428 (0.815–2.501) |
| TNM-stage (III–IV) | <0.001 | 3.084 (1.624–5.858) | <0.001 | 3.122 (1.614–6.038) |
| Treatment (comprehensive) | 0.064 | 0.544 (0.287–1.037) | 0.130 | 0.598 (0.308–1.163) |
Univariate cox regression analysis for prognosis of colorectal carcinoma.
Abbreviations: PFS, progression-free survival; OS, overall survival; HR (95% CI), hazard ratio and its 95% confidence interval. Univariate and multivariate COX regression analyses of clinicopathological characteristics were performed based on the data of the AQP1 group. The score of AQP expression (<cut-off value), age (<60 years old), gender (female), primary tumor site (right), histological grade (high and moderate), TNM-stage (I–II) and treatment modality (surgery only) were set as references in COX regression analyses. Comprehensive treatment indicated that patients received surgery plus with neoadjuvant therapy and or adjuvant therapy.
Bold values are significant at p < 0.05.
Since the Allred_score and H_score were two indicators to evaluate the same protein expression and the univariate COX analysis showed that the H_score was more significant than Allred_score in PFS and OS assessment (PFS, p = 0.008 vs. 0.017; OS, p = 0.003 vs. 0.008), the multivariate COX regression analysis was performed using H_score of AQP1 and indicated that AQP1 was no longer an independent risk factor for 5-year PFS (p = 0.086, HR = 1.866, HR95% CI: 0.916–3.800), but an independent risk factor for 5-year OS (p = 0.033, HR = 2.274, HR95% CI: 1.069–4.836, Table 3).
TABLE 3
| Variate | PFS | OS | ||
|---|---|---|---|---|
| P | HR95% CI | P | HR95% CI | |
| Age (≥60 years) | 0.252 | 1.483 (0.756–2.911) | 0.229 | 1.533 (0.764–3.076) |
| TNM stage (III-IV) | 0.007 | 2.494 (1.285–4.839) | 0.010 | 2.450 (1.243–4.827) |
| AQP1 (H_score ≥116.17) | 0.086 | 1.866 (0.916–3.800) | 0.033 | 2.274 (1.069–4.836) |
Multivariate cox regression analysis for prognosis of colorectal carcinoma.
Abbreviations: PFS, progression free survival; OS, overall survival; HR (95% CI), 95% confidence interval of the hazard ratio. Multivariate COX regression analysis of clinicopathological characteristics was conducted using AQP1 group data. The age (<60 years), TNM stage (I–II) and AQP1 (H_score <116.17) were set as references in COX regression analyses.
Bold values are significant at p < 0.05.
Discussion
In the present study, we investigated the correlation between AQP1, AQP3 and AQP5 expression and clinicopathological features or prognosis in 121 patients with CRC. The AQP1 expression, AQP3 expression and AQP5 expression were related to regional lymph node metastasis, histological grading, and tumor location of CRC, respectively. In survival analysis, the AQP1 high expression was related to poor 5-year PFS and OS and was an independent prognostic factor for 5-year OS, but the AQP3 and AQP5 expression were not significantly correlated with prognosis in CRC.
This study found that AQP1 (H_score) expression was significantly higher in the positive lymph node group than negative lymph node group (134.81 ± 44.573 vs. 105.978 ± 46.122, p = 0.003) and AQP1 (H_score) high expression group had significantly worse 5-year PFS than that of the AQP1 low expression group (52% vs. 78%, p = 0.006). These results were similar to the work by Yoshida et al. [16] who found that high AQP1 expression in stage II/III colon cancer was strongly associated with regional lymph node metastasis and the 5-year survival rate was significantly lower in the positive AQP1 expression group than the negative group (73.7% vs. 87.9%, p = 0.03). In contrast, Byung et al. [17] showed that patients with AQP1 high expression are less likely to develop regional lymph node metastasis which was inconsistent with the theory that high AQP1 expression can promote tumor invasion and metastasis.
Although the molecular mechanism of AQP1 in cancer biology is not fully understood, numerous studies have indicated that AQP1 is involved in the angiogenesis, migration, and proliferation of tumor cells, which plays an important role in the development of cancer [23]. Potential downstream effectors in the signaling pathways involved in AQP1-mediated tumor progression include β-linked protein, Lin-7, FAK, MMP2, MMP9, and histone proteinase B [24]. A representative study reported that AQP1 may enhance the migratory ability and invasiveness of tumor cells by mediating the Wnt/β-catenin signaling pathway and stabilizing the cadherin/β-catenin/Lin-7/F-actin complex on cell membranes [25, 26]. β-catenin as an intracellular signal transducer in the canonical Wnt signaling pathway regulates the expression of downstream genes (c-Myc, cyclinD1, c-Jun, and FRA1), which leads to cell proliferation, differentiation, and inhibition of apoptosis [27]. Therefore, regional lymph node metastasis should be associated with high AQP1 expression, rather than low expression. The high AQP1 expression was strongly associated with worse 5-year PFS and OS, which supports that high AQP1 expression can promote tumor invasion and reduce patient survival. There was no significant correlation between AQP1 expression and other clinicopathological characteristics (gender, age, tumor location, histological grading, T stage, and M stage).
The high expression of AQP3 has been observed in several cancers, which promotes to metastasis, proliferation, and epithelial-to-mesenchymal transition (EMT) [28]. Despite previous studies found that the high expression of AQP3 was related to the degree of lymphatic metastasis and differentiation of CRC [29], this study only found that the expression of AQP3 was related to the histological grading of CRC. Specifically, there was no linear relationship between AQP3 expression and histological grading which may be partially attributed to the small sample size of patients with low differentiation (n = 11). Further studies with more low differentiation of sample sizes are needed to validate the result.
In a recent study, Byung et al. [17] showed that AQP5 was not associated with PFS and OS of CRC. This outcome is contrary to that of Tao Shan et al. [30] who found that AQP5 was closely correlated with poor prognosis. According to our current study, the expression of AQP5 was related to the location of the tumor which might remind us that AQP5 played a different role in left and right-sided CRC. There was no significant correlation between AQP5 expression and other clinicopathological characteristics (age, gender, histological grading, and TNM stage).
Although both Allred_score and H_score are semi-quantitative indicators for evaluating protein expression, the range of H_score (0–300) is significantly higher than that of Allred_score (0–8). Therefore, H_score can be analyzed as a continuous variate. As the statistical efficiency of the H_score was generally better than Allred_score in this study, it was considered that H_score could describe AQP expression more accurately than Allred_score and was a better indicator for evaluating protein immunohistochemical results. Qupath is a free open-source digital pathological analysis software developed by the Center for Cancer Research and Cell Biology of Queen’s University in Belfast, which has been widely used all over the world [31]. Several studies published in Nature [32], Cell [33], and Science [34] have demonstrated that quantitative analysis of biomarkers using Qupath software has good reliability and repeatability.
This study has some potential limitations. Firstly, it had a retrospective nature and a relatively small number of patients. In particular, there were only 11 cases of poor-differentiated CRC, more subjects need to be included in further evaluation. Secondly, the heterogeneity of staining may be affected by different sampling methods (TMA vs. whole slides), which is a possible reason that may contribute to different results in the literature. In this study, two tissue cores were carefully selected by a pathologist with 16-year experiences in gastrointestinal cancer, which may compensate for the insufficient representativity of TMA to some extent. Furthermore, we performed a long-time follow-up and digital scoring method for IHC staining, which may supply solid support for the conclusion of this study.
In conclusion, our data suggested that the expression levels of AQP1, AQP3 and AQP5 were associated with regional lymph node metastasis, histological grading, and tumor location of CRC, respectively. However, only AQP1 expression level was an independent risk factor for the prognosis of CRC.
Statements
Data availability statement
The original contributions presented in the study are included in the article/Supplementary Material, further inquiries can be directed to the corresponding authors.
Ethics statement
The studies involving human participants were reviewed and approved by Ethics Committee of Xijing Hospital. The patients/participants provided their written informed consent to participate in this study. Written informed consent was obtained from the individual(s) for the publication of any potentially identifiable images or data included in this article.
Author contributions
JZ, GZ, and YH designed the study, analyzed the data, and wrote the article. JZ and QQ were the supervisor of the study and revised the paper. LC and ZL collated the pathological data of patients and prepared the tables. LG and JT performed digital data analysis work and made the figures. All authors contributed to the article and approved the submitted version.
Funding
This study was funded by Key Research and Development Projects in Shaanxi (2018ZDXM-SF-059).
Acknowledgments
The author thanks Prof. Jing Zhang from Department of Pathology at Xijing Hospital for providing language assistance.
Conflict of interest
The authors declare that the research was conducted in the absence of any commercial or financial relationships that could be construed as a potential conflict of interest.
Supplementary material
The Supplementary Material for this article can be found online at: https://www.por-journal.com/articles/10.3389/pore.2023.1611179/full#supplementary-material
References
1.
Sung H Ferlay J Siegel RL Laversanne M Soerjomataram I Jemal A et al Global cancer statistics 2020: GLOBOCAN estimates of incidence and mortality worldwide for 36 cancers in 185 countries. CA Cancer J Clin (2021) 71:209–49. 10.3322/caac.21660
2.
Bender U Rho YS Barrera I Aghajanyan S Acoba J Kavan P . Adjuvant therapy for stages II and III colon cancer: Risk stratification, treatment duration, and future directions. Curr Oncol (2019) 26:S43–s52. 10.3747/co.26.5605
3.
Siegel RL Miller KD Sauer AG Fedewa SA Butterly LF Anderson JC et al Colorectal cancer statistics, 2020. Ca-a Cancer J Clinicians (2020) 70:145–64. 10.3322/caac.21601
4.
Malki A Abu ElRuz R Gupta I Allouch A Vranic S Al Moustafa AE . Molecular mechanisms of colon cancer progression and metastasis: Recent insights and advancements. Int J Mol Sci (2021) 22:130. 10.3390/ijms22010130
5.
Bregni G Telli TA Camera S Deleporte A Moretti L Bali AM et al Adjuvant chemotherapy for rectal cancer: Current evidence and recommendations for clinical practice. Cancer Treat Rev (2020) 83:101948. 10.1016/j.ctrv.2019.101948
6.
Ribatti D Ranieri G Annese T Nico B . Aquaporins in cancer. Biochim Biophys Acta (2014) 1840:1550–3. 10.1016/j.bbagen.2013.09.025
7.
Zannetti A Benga G Brunetti A Napolitano F Avallone L Pelagalli A . Role of aquaporins in the physiological functions of mesenchymal stem cells. Cells (2020) 9:2678. 10.3390/cells9122678
8.
Prata C Hrelia S Fiorentini D . Peroxiporins in cancer. Int J Mol Sci (2019) 20:1371. 10.3390/ijms20061371
9.
Moon CS Moon D Kang SK . Aquaporins in cancer biology. Front Oncol (2022) 12:782829. 10.3389/fonc.2022.782829
10.
Papadopoulos MC Saadoun S . Key roles of aquaporins in tumor biology. Biochim Biophys Acta-Biomembranes (2015) 1848:2576–83. 10.1016/j.bbamem.2014.09.001
11.
Morrissey JJ Mellnick VM Luo J Siegel MJ Figenshau RS Bhayani S et al Evaluation of urine aquaporin-1 and perilipin-2 concentrations as biomarkers to screen for renal cell carcinoma A prospective cohort study. Jama Oncol (2015) 1:204–12. 10.1001/jamaoncol.2015.0213
12.
Kushwaha PP Verma S Gupta S . Aquaporins as prognostic biomarker in prostate cancer. Cancers (Basel) (2023) 15:331. 10.3390/cancers15020331
13.
Rodrigues C Milkovic L Bujak IT Tomljanovic M Soveral G Cipak Gasparovic A . Lipid profile and aquaporin expression under oxidative stress in breast cancer cells of different malignancies. Oxid Med Cell Longev (2019) 2019:2061830. 10.1155/2019/2061830
14.
Chen G Song H Yang Z Du T Zheng Y Lu Z et al AQP5 is a novel prognostic biomarker in pancreatic adenocarcinoma. Front Oncol (2022) 12:890193. 10.3389/fonc.2022.890193
15.
Kao YC Jheng JR Pan HJ Liao WY Lee CH Kuo PL . Elevated hydrostatic pressure enhances the motility and enlarges the size of the lung cancer cells through aquaporin upregulation mediated by caveolin-1 and ERK1/2 signaling. Oncogene (2017) 36:863–74. 10.1038/onc.2016.255
16.
Yoshida T Hojo S Sekine S Sawada S Okumura T Nagata T et al Expression of aquaporin-1 is a poor prognostic factor for stage II and III colon cancer. Mol Clin Oncol (2013) 1:953–8. 10.3892/mco.2013.165
17.
Kang BW Kim JG Lee SJ Chae YS Jeong JY Yoon GS et al Expression of aquaporin-1, aquaporin-3, and aquaporin-5 correlates with nodal metastasis in colon cancer. Oncology (2015) 88:369–76. 10.1159/000369073
18.
Imaizumi H Ishibashi K Takenoshita S Ishida H . Aquaporin 1 expression is associated with response to adjuvant chemotherapy in stage II and III colorectal cancer. Oncol Lett (2018) 15:6450–6. 10.3892/ol.2018.8170
19.
Zhang G Ma W Dong H Shu J Hou W Guo Y et al Based on histogram analysis: ADC(aqp) derived from ultra-high b-value DWI could be a non-invasive specific biomarker for rectal cancer prognosis. Sci Rep (2020) 10:10158. 10.1038/s41598-020-67263-4
20.
Moosavi MS Elham Y . Aquaporins 1, 3 and 5 in different tumors, their expression, prognosis value and role as new therapeutic targets. Pathol Oncol Res (2020) 26:615–25. 10.1007/s12253-019-00646-9
21.
Harvey JM Clark GM Osborne CK Allred DC . Estrogen receptor status by immunohistochemistry is superior to the ligand-binding assay for predicting response to adjuvant endocrine therapy in breast cancer. J Clin Oncol (1999) 17:1474–81. 10.1200/jco.1999.17.5.1474
22.
McCarty KS Jr Miller LS Cox EB Konrath J McCarty KS . Estrogen receptor analyses. Correlation of biochemical and immunohistochemical methods using monoclonal antireceptor antibodies. Arch Pathol Lab Med (1985) 109:716–21.
23.
Ribatti D Ranieri G Annese T Nico B . Aquaporins in cancer. Biochim Biophys Acta-General Subjects (2014) 1840:1550–3. 10.1016/j.bbagen.2013.09.025
24.
Tomita Y Dorward H Yool AJ Smith E Townsend AR Price TJ et al Role of aquaporin 1 signalling in cancer development and progression. Int J Mol Sci (2017) 18:299. 10.3390/ijms18020299
25.
Meng FB Rui YF Xu LL Wan C Jiang XH Li G . Aqp1 enhances migration of bone marrow mesenchymal stem cells through regulation of FAK and beta-catenin. Stem Cell Development (2014) 23:66–75. 10.1089/scd.2013.0185
26.
Clevers H Nusse R . Wnt/β-catenin signaling and disease. Cell (2012) 149:1192–205. 10.1016/j.cell.2012.05.012
27.
Tetsu O McCormick F . Beta-catenin regulates expression of cyclin D1 in colon carcinoma cells. Nature (1999) 398:422–6. 10.1038/18884
28.
Marlar S Jensen HH Login FH Nejsum LN . Aquaporin-3 in cancer. Int J Mol Sci (2017) 18:2106. 10.3390/ijms18102106
29.
Li A Lu DH Zhang YP Li J Fang Y Li F et al Critical role of aquaporin-3 in epidermal growth factor-induced migration of colorectal carcinoma cells and its clinical significance. Oncol Rep (2013) 29:535–40. 10.3892/or.2012.2144
30.
Shan T Cui X Li W Lin W Li Y . AQP5: A novel biomarker that predicts poor clinical outcome in colorectal cancer. Oncol Rep (2014) 32:1564–70. 10.3892/or.2014.3377
31.
Humphries MP Maxwell P Salto-Tellez M , QuPath: The global impact of an open source digital pathology system. Comput Struct Biotechnol J (2021) 19:852–9. 10.1016/j.csbj.2021.01.022
32.
Roberti MP Yonekura S Duong CPM Picard M Ferrere G Alou MT et al Chemotherapy-induced ileal crypt apoptosis and the ileal microbiome shape immunosurveillance and prognosis of proximal colon cancer. Nat Med (2020) 26:919–31. 10.1038/s41591-020-0882-8
33.
Choudhury SR Babes L Rahn JJ Ahn BY Goring KAR King JC et al Dipeptidase-1 is an adhesion receptor for neutrophil recruitment in lungs and liver. Cell (2019) 178:1205–21. 10.1016/j.cell.2019.07.017
34.
Nejman D Livyatan I Fuks G Gavert N Zwang Y Geller LT et al The human tumor microbiome is composed of tumor type-specific intracellular bacteria. Science (2020) 368:973–80. 10.1126/science.aay9189
Summary
Keywords
biomarker, prognosis, clinical features, colorectal cancer, aquaporin
Citation
Zhang G, Hao Y, Chen L, Li Z, Gao L, Tian J, Qiao Q and Zhang J (2023) Expression of aquaporin 1, 3 and 5 in colorectal carcinoma: correlation with clinicopathological characteristics and prognosis. Pathol. Oncol. Res. 29:1611179. doi: 10.3389/pore.2023.1611179
Received
13 March 2023
Accepted
24 May 2023
Published
02 June 2023
Volume
29 - 2023
Edited by
Anna Sebestyén, Semmelweis University, Hungary
Updates
Copyright
© 2023 Zhang, Hao, Chen, Li, Gao, Tian, Qiao and Zhang.
This is an open-access article distributed under the terms of the Creative Commons Attribution License (CC BY). The use, distribution or reproduction in other forums is permitted, provided the original author(s) and the copyright owner(s) are credited and that the original publication in this journal is cited, in accordance with accepted academic practice. No use, distribution or reproduction is permitted which does not comply with these terms.
*Correspondence: Jinsong Zhang, stspine@163.com; Qing Qiao, qqing44@fmmu.edu.cn
†These authors have contributed equally to this work and share first authorship
Disclaimer
All claims expressed in this article are solely those of the authors and do not necessarily represent those of their affiliated organizations, or those of the publisher, the editors and the reviewers. Any product that may be evaluated in this article or claim that may be made by its manufacturer is not guaranteed or endorsed by the publisher.