Abstract
Background: Uveal Melanoma (UM) is the most prevalent primary intraocular malignancy in adults. This study assessed the importance of chromatin regulators (CRs) in UM and developed a model to predict UM prognosis.
Methods: Gene expression data and clinical information for UM were obtained from public databases. Samples were typed according to the gene expression of CRs associated with UM prognosis. The prognostic key genes were further screened by the protein interaction network, and the risk model was to predict UM prognosis using the least absolute shrinkage and selection operator (LASSO) regression analysis and performed a test of the risk mode. In addition, we performed gene set variation analysis, tumor microenvironment, and tumor immune analysis between subtypes and risk groups to explore the mechanisms influencing the development of UM.
Results: We constructed a signature model consisting of three CRs (RUVBL1, SIRT3, and SMARCD3), which was shown to be accurate, and valid for predicting prognostic outcomes in UM. Higher immune cell infiltration in poor prognostic subtypes and risk groups. The Tumor immune analysis and Tumor Immune Dysfunction and Exclusion (TIDE) score provided a basis for clinical immunotherapy in UM.
Conclusion: The risk model has prognostic value for UM survival and provides new insights into the treatment of UM.
Introduction
Uveal melanoma (UM) is the most prevalent primary intraocular malignancy in adults [1, 2]. Primary UM is usually well controlled by surgery or radiotherapy, but metastases still occur in more than half of UM patients [3, 4]. UM most often metastasizes to the liver, and has a median survival of less than 1 year after metastasis [5–7]. Over the years, there has been an evolution in prognostic assessment (metastatic risk) of UM, from clinical and histological features to the analysis of genetic mutations and chromosomal abnormalities. These included clinical and histological features (patient age, tumor size, ciliary body involvement, extraocular extension, and so on), the genetic mutations [G protein subunit alpha q (GNAQ), G protein subunit alpha 11 (GNA11), Splicing Factor 3b Subunit 1(SF3B1), BRCA1 associated protein 1(BAP1), and Eukaryotic Translation Initiation Factor 1A X-Linked (EIF1AX)], and the composition of chromosomal anomalies of chromosome 3, 6 and 8 [8]. Some studies classify tumors and assess prognosis based on gene expression and chromosomal data [9, 10]. Despite extensive studies, the prognosis of UM has not significantly improved and there are no efficient therapies for metastatic UM, and treatments for metastatic UM such as immune checkpoint inhibitors (ICI), vaccination and t-cell therapy are much less effective than for other tumors [11–15]. Therefore, selecting key genomes for the stratification of UM patients and construction of tumor prediction models could provide new strategies for more precise molecular subtyping, screening of prognostic markers and potential therapeutic targets, and corresponding personalized treatment. At present, the rapid development of bioinformatics analysis is conducive to the screening of prognostic markers related to UM [16–18].
Epigenetic alterations can lead to aberrant gene regulation, which plays an important role in tumorigenesis by silencing tumor suppressor genes or activating oncogenes. These epigenetic changes include DNA methylation, histone modifications, and small non-coding RNA, many of which are associated with the initiation and progression of UM [19]. It has been found that mutations in BAP1, SF3B1, and EIF1AX in UM with different prognoses exhibit different types of methylation cluster status, and hypermethylation of chromosome 3 in UM is also associated with downregulation of BAP1 gene expression, which was further confirmed in vitro experiments that knockdown of BAP1 gene or deletion of the protein induces effects on methylation status in UM cells, causing UM cells to exhibit a low metastatic risk phenotype [20–22]. Histone modifications have also been associated with UM metastasis and proliferation [23–25]. MicroRNAs, the most widely studied small non-coding RNAs, have been shown to have dysregulated anti-apoptotic effects, accelerated cell cycle progression, and enhanced invasion and metastasis of many cancers [26]. Epigenetic mechanisms have been found to regulate the expression and activation of miRNAs in UM, which in turn regulate the progression of UM [27, 28]. These studies suggest that epigenetic alterations are closely associated with the onset and progression of UM and that epigenetic mechanisms play an important role in the development of UM.
Chromatin regulators (CRs) are drivers of epigenetic alterations and are classified by function as DNA methylators, histone modifiers, and chromatin remodelers [29–31]. In recent years, abnormal expression of CRs is closely associated with the development of several diseases, including several cancers [32–35]. Aberrant expression of CRs CHD8 and CTCF led to abnormal chromatin structure and epigenetic changes in many cancer-associated genes, ultimately leading to tumor progression and metastasis in prostate cancer patients [36]. Several CRs associated with cancer subtypes and prognosis have been identified as potential drivers of carcinogenesis [37]. There were very few studies on the role of CRs in UM, so a comprehensive analysis of CRs may make a theoretical contribution to the diagnosis, classification, prognostic assessment, and other features of UM. The simultaneous screening of key genes for the stratification of UM patients and the construction of tumor prediction models may provide new strategies for more precise molecular typing and corresponding personalized treatment.
In this study, we applied bioinformatics analysis to identify the key regulators and prognostic genes of CRs in UM. We applied the Non-negative Matrix Factorization (NMF) to cluster The Cancer Genome Atlas (TCGA) dataset based on the expression levels of prognostic-related CRs genes in UM, and the differences in patient prognosis and clinical traits between subtypes were also studied. We also screened core genes using protein interaction networks and constructed prognostic risk models using univariate Cox regression, least absolute shrinkage and selection operator (LASSO) regression, and multivariate Cox regression analysis. Then the accuracy, independence, and validity of the risk model were assessed in the training cohort and validation cohort. In addition, the relationship of the risk model with the tumor microenvironment, immune infiltration and immune checkpoints, and drug sensitivity was investigated, thereby expanding the risk model prognostic values for patients with UM. In summary, our work constructs a new risk model based on CRs gene expression levels associated with UM prognosis, which may have implications for the development of diagnosis and treatment of UM.
Materials and methods
Data download and collation
A list of CRs (870 genes) was collected from previous research [37], and the list of the CRs gene name was shown in Supplementary Table S1. The mRNA data and clinical and pathological characteristics were obtained from three datasets, including the TCGA-UM downloaded from the public dataset TCGA (The Cancer Genome Atlas, https://portal.gdc.cancer.gov/) and the UCSC Xena website (https://xena.ucsc.edu/), the GEO database (Gene Expression Omnibus, https://www.ncbi.nlm.nih.gov/geo/) datasets GSE22138and GSE84976 [38, 39]. All data were normalized using R software, and the ComBat method from the “SVA” R package was used to remove the batch effects among three datasets [40]. The Principal Component Analysis (PCA) showed the batch correction of three datasets.
Classification validation and variance analysis of TCGA data sets
First, CRs genes significantly associated with UM prognosis were screened by univariate Cox analysis, and prognosis-related CRs genes were treated with the R package “survival” with selection p < 0.01. Unsupervised subgroups of TCGA-UM datasets were identified using the R package “NMF” [41], based on these prognosis-related CRs genes. The subtypes were verified by PCA using the R package “ggplot2.” The Kaplan–Meier survival curves of the different subgroups were analyzed and plotted using the R packages “survival” and “survminer” [including overall survival (OS) and progression-free survival (PFS)].
To explore the differences in clinical and pathological traits, tumor microenvironment, and tumor immunity between the two subgroups. The gene expression of prognosis-related CRs genes and clinical traits in different subtypes were visualized using the R package “Heatmap” and “ggplot2,” respectively. The KEGG pathway was analyzed to explore the differences in the biological processes between the different subgroups using the R package “GSVA.” The ESTIMATE algorithm calculated immune, stromal, and ESTIMATE scores in different subtypes by using the R package “estimate.” A ssGSEA algorithm was used to investigate the immune cell infiltration relationships between the different subgroups using the R package “GSVA” and “GSEABase,” R package “reshape2,” “ggpubr,” and “pheatmap” was used to draw a heatmap and differential boxplot.
Screening for key genes
To further screen the key CRs genes, the protein regulatory networks of the prognosis-related CRs genes were analyzed using the STRING online database, and only interactions that enjoyed a minimum required combined score >0.4 were set as significant, and visualized the results by Cytoscape software. Furthermore, the key genes were identified based on the PPI network by using cytoHubba, which is another plug-in of Cytoscape. We defined the genes with node (degree > 9) as key genes and used them for subsequent study analysis.
Risk model construction
Based on key CRs genes expression profiles and survival data were combined for further analysis, and to further minimize the dimensionality and build the risk signature, The R package “glmnet” and “survminer” were used to perform the least absolute shrinkage and selection operator (LASSO) regression analysis to determine the minimum lambda value of the lasso model, and further reduce the number of genes by multivariate Cox analysis to determine the final genes and coefficients that constitute the risk model. The patients’ risk scores were then determined. Before that, the TCGA dataset was randomly grouped to obtain the TCGA training group (N = 56) and testing group (N = 28). The risk score formula for the sample is as follows:
Risk score = (Coef1 *mRNA1 expression) + (Coef2 * mRNA2 expression) +…+ (Coef n *mRNA n expression).
The verification datasets GSE22138 and GSE84976 were categorized into high- and low-risk groups based on the risk score’s median value in the TCGA training group.
Risk model validation
To assess the prognostic value of the risk model, we used the following approaches. First, the predictive ability of the risk model was assessed by using the R package “survminer” and “timeROC,” and the Kaplan-Meier curves, with p < 0.05 between the two groups indicating a significant difference in overall or progression-free survival. ROC curves at 1, 3, and 5 years were used to measure the accuracy of the predictive ability of the risk model, with AUC (Area Under ROC Curve) value > 0.7 as a valid criterion. Then, the risk model was compared with other clinical characteristics. Finally, the “rms” R package plotted the clinical nomogram. The performance of the nomogram in predicting the overall survival (OS) of UM patients was evaluated using factors such as sex, age, stage, TNM staging of the tumor, and risk score. The calibration curve then proved the nomogram’s efficacy.
Gene set variation analysis
To explore the potential molecular mechanisms affecting prognosis, we performed functional enrichment analysis of genes in high- and low-risk groups. The KEGG pathway was analyzed to explore the differences in the biological processes between the high and low-risk group using the R packages “GSVA.”
Tumor microenvironment and immune landscape analysis
To confirm whether the CRs characteristics of the risk model were correlated with the tumor microenvironment and tumor immunity, we assessed the differences in ESTIMATE scoring and immune cell infiltration between the two groups. The ESTIMATE algorithm calculated immune, stromal, and ESTIMATE scores in different subtypes by using the R package “estimate.” Correlation tests were used to calculate the correlation between the three signature genes and risk scores and the expression of immune checkpoint-associated genes. The TIDE algorithm was applied to predict the response to immunotherapy in both high and low-risk groups.
Analysis of signature genes in the risk model
To observe the distribution of TCGA samples in terms of subtyping and risk grouping, we performed an analysis using R packages “ggalluvial” and “ggplot2,” and presented the results with a Sankey diagram. The distribution of 80 TCGA UM patients in subtypes and risk subgroups was statistically and consistently analyzed, and the results were presented in a 2 × 2 contingency table, while SPSS software was applied to calculate the kappa coefficient to verify the consistency of the two classifications. In addition, we compared whether risk scores differed between subtypes, and the expression and survival analysis of signature genes in risk models between risk subgroups was done by R packages “limma” and “survminer.” Dividing the dataset samples into high and low gene expression groups by the median value of characteristic gene expression (which varies across datasets).
Statistics analysis
All statistical analyses were performed in R software (version 4.2.0). p < 0.05 was considered statistically significant unless otherwise stated. The consistency test was calculated by SPSS software, and a kappa coefficient (κ) greater than 0.61 indicated a good agreement [42, 43].
Results
Detailed clinical data from three study cohorts
A total of three cohorts were used in this study: 80 UM samples that came from TCGA-UM. The datasets GSE22138 with 63 samples and GSE84976 with 28 samples. The detailed baseline data, clinical and pathological characteristics, and survival time of the three cohorts were presented in Table 1. Three data sets were calibrated by combat functions, and PCA showed successful correction of batch effects (Supplementary Figure S1).
TABLE 1
| Characteristics | Training cohort | Validation cohort | |
|---|---|---|---|
| (TCGA-UM, n = 80) | GSE22138 (N = 63) | GSE84976 (N = 28) | |
| Age at diagnosis, years | |||
| ≤65 | 46 | 36 | 13 |
| >65 | 34 | 27 | 15 |
| Gender | |||
| Female | 35 | 24 | — |
| Male | 45 | 39 | — |
| Stage | |||
| Stage I | 0 | — | — |
| Stage II | 36 | — | — |
| Stage III | 40 | — | — |
| Stage IV | 4 | — | — |
| T | |||
| T1 | 0 | — | — |
| T2 | 5 | — | — |
| T3 | 36 | — | — |
| T4 | 39 | — | — |
| N | |||
| N0 | 76 | — | — |
| Unknown | 4 | — | — |
| M | |||
| M0 | 73 | — | — |
| M1 | 4 | — | — |
| Unknown | 3 | — | — |
| Tumor location | |||
| Posterior to equator | 67 | 54 | — |
| Anterior to equator | 5 | 3 | — |
| All over the eye | 8 | 1 | — |
| Unknown | 0 | 5 | — |
| Tumor diameter | |||
| ≤15 mm | 24 | 27 | — |
| >15 mm | 55 | 26 | — |
| unknown | 1 | 10 | — |
| Tumor thickness | |||
| ≤10 mm | 37 | 12 | — |
| >10 mm | 43 | 51 | — |
| Extrascleral extension | |||
| Yes | 7 | 5 | — |
| No | 68 | 48 | — |
| Unknown | 5 | 10 | — |
| Person neoplasm cancer status | |||
| Tumor free | 56 | — | 28 |
| With tumor | 9 | — | 0 |
| Unknown | 15 | — | 0 |
| OS(years) | 0.01∼7.12 | — | 1.17∼13 |
| PFS(years) | 0.01∼6.84 | 0.01∼10.05 | — |
The detailed baseline data and clinical characteristics of the three cohorts.
Typing and analysis of CRs-based subtypes
First, the univariate Cox regression analysis identified 111 CRs genes that were significantly associated with UM prognosis, and the results of the analysis are shown in Supplementary Table S2. Then, based on the expression of these 111 genes, the TCGA samples were divided into two subtypes (namely C1, n = 41, and C2 n = 39) by NMF analysis according to the results of the heatmap of subtypes (Figure 1A). As shown by the results of PCA analysis (Figure 1B), 80 patients were well grouped into two distinct subtypes. The Kaplan-Meier (KM) curve results showed that the C2 subtype was the high-risk group with significantly shorter OS and PFS (p < 0.001) (Figures 1C, D). These results indicated that TCGA-UM can be classified based on prognosis-related CRs genes.
FIGURE 1
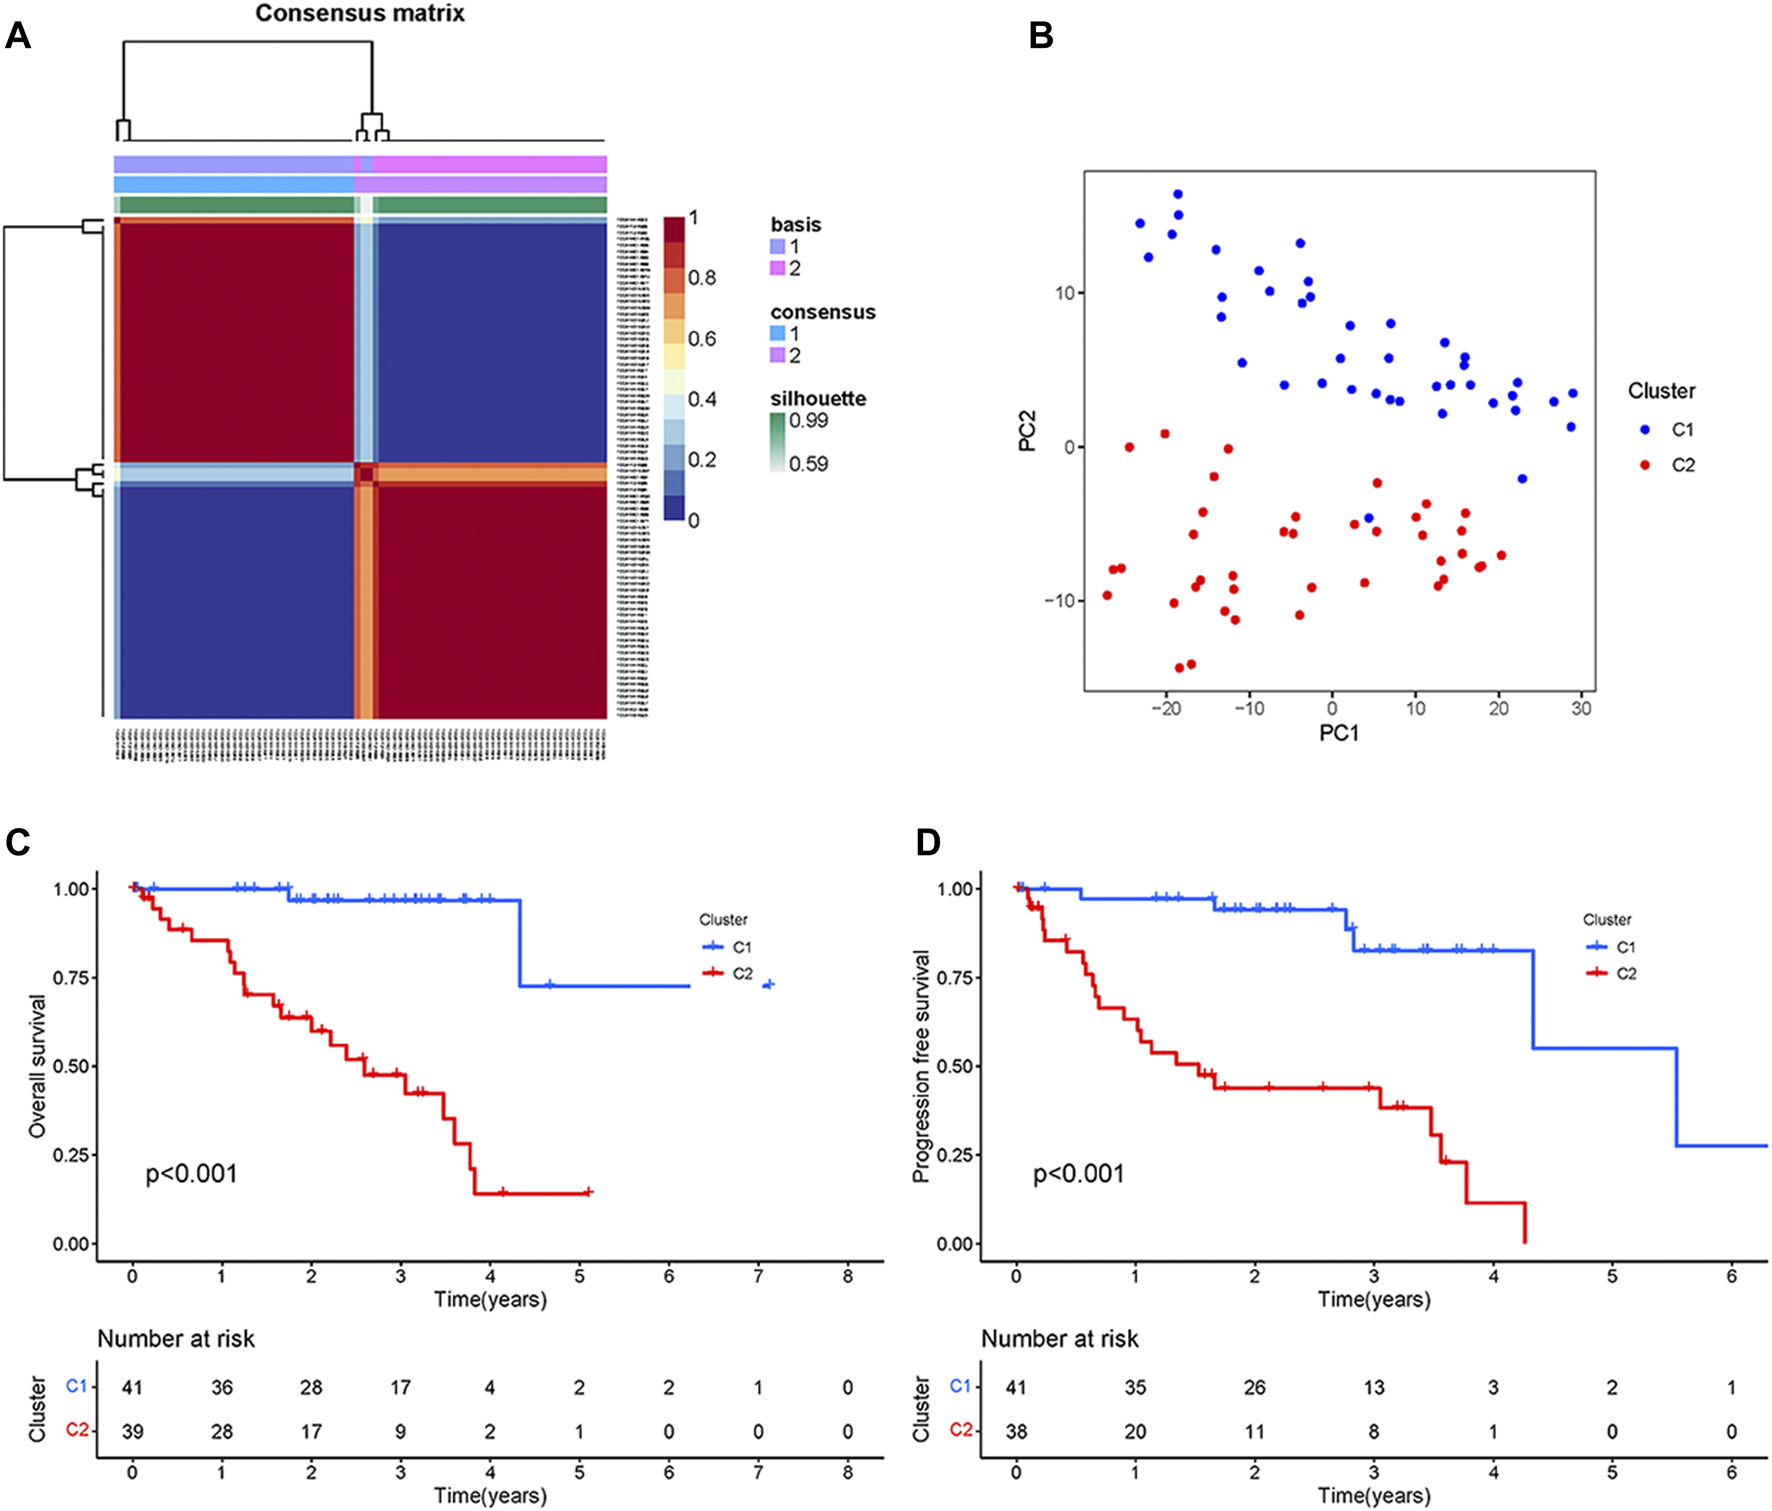
Typing and Identification of CRs-based Subtypes: (A) The cluster heatmap of tumor subtypes. (B) PCA showed a significant difference between the two subtypes. (C) Survival curves of overall survival for patients with two subtypes. (D) Survival curves of progression-free survival for patients with two subtypes.
To further explore the differences between these two subgroups, we analyzed the distribution of prognosis-related CRs genes and clinical traits among different subtypes. As the results in Figure 2A showed that the expression of prognosis-related CRs genes showed a difference between the two subgroups, with differences in tumor stage and tumor diameter among clinical traits (p < 0.05) (Figure 2B). The results indicated that subgroup C2 had a distinct pattern of immune infiltration compared to subgroup C1 (Figure 2C), and the results of the analysis of tumor microenvironment and immune infiltration levels between the two subtypes are shown in Figure 2D, the stromal, immune, and estimate scores of the C2 subgroup were higher than those of the C1 subgroup, and the differences were statistically significant (p < 0.05). The results of the different KEGG pathways within the two subtypes showed that subgroup C1 was highly enriched in substance metabolism (including pyrimidine metabolism, amino sugar and nucleotide sugar metabolism, and sulfur metabolism), and in addition, the C2 subgroup was also highly enriched in apoptosis, P53 signaling pathway, and O-glycan biosynthesis (Figure 2E), all of which KEGG pathways are closely associated with tumors. Furthermore, subgroup C2 had a significantly higher abundance of immune cells—including CD8 T cells, activated memory CD4 T cells, follicular helper T cells, and Macrophages M1, while the abundance of immune cells (including resting memory CD4 T cells and resting Mast cells) was significantly higher in subgroup C1 than in subgroup C2 (Figure 2F). These results suggest that the two subgroups have different characteristics in terms of the KEGG pathway, tumor microenvironment, and immune infiltration level.
FIGURE 2
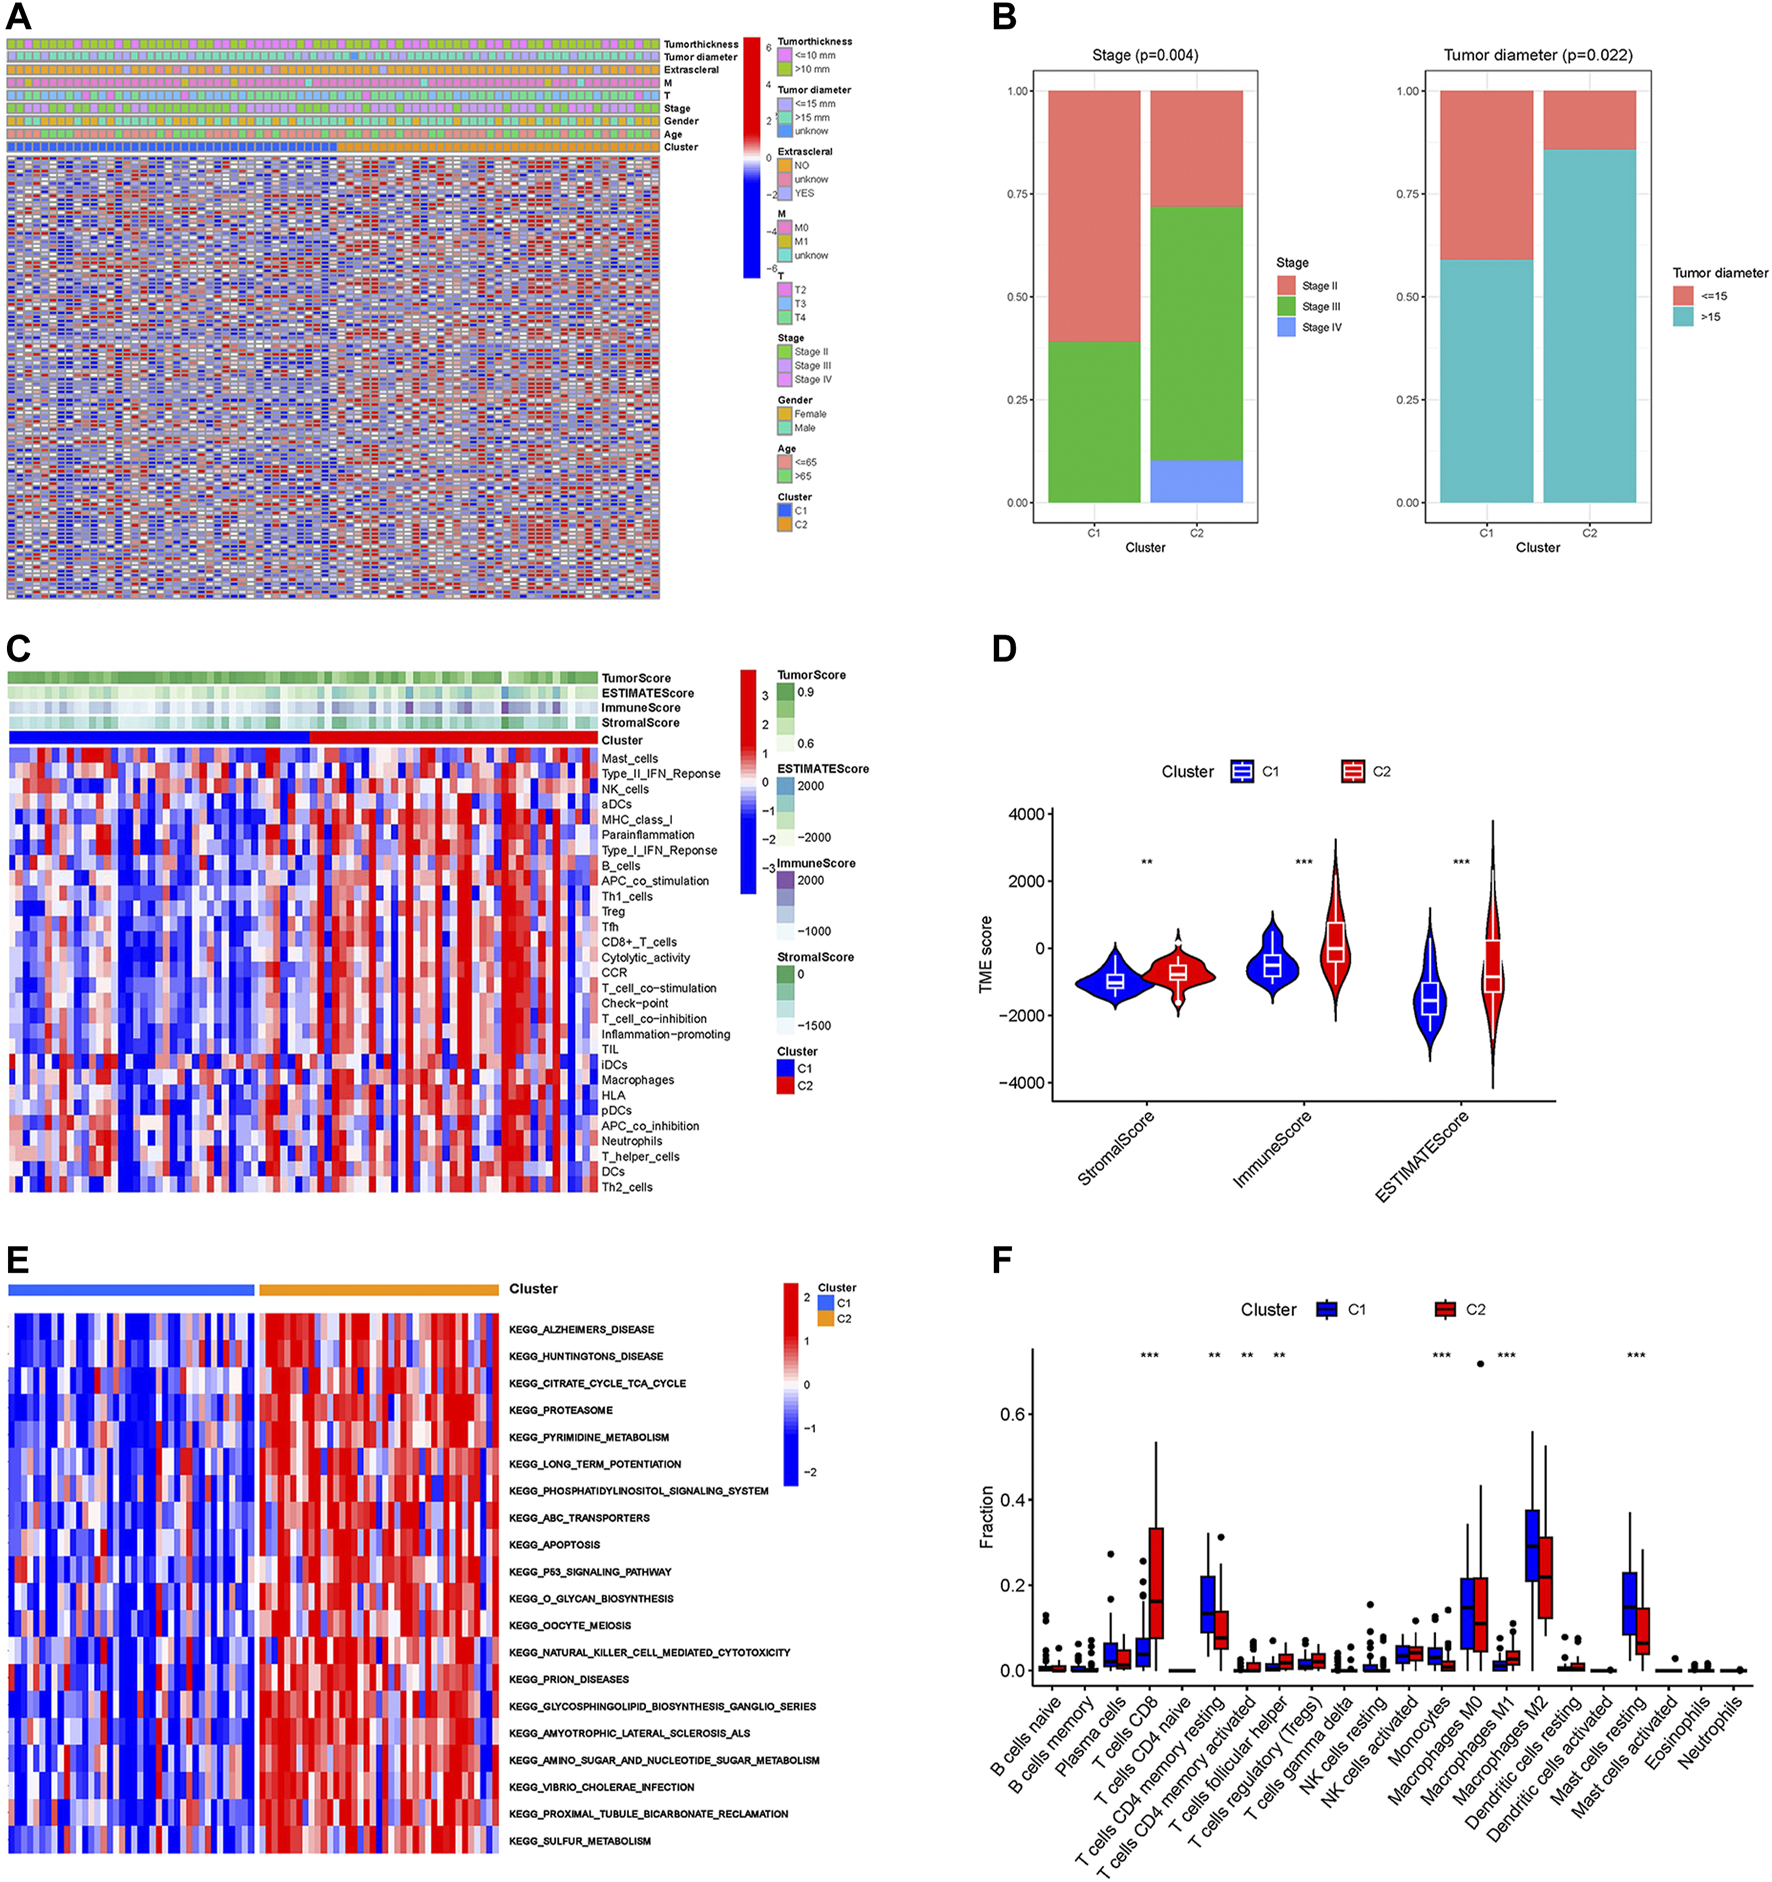
Different characteristics between two subtypes. (A) The heatmap of expression levels of prognosis-related CRs genes and clinical traits in the two subgroups. (B) Percentage distribution of clinical traits with significant differences between the two subtypes. (C) The ssGSEA analysis of the immune cell infiltration level in the two subgroups. (D) Difference analysis of TME scores. (E) KEGG pathway analyses of GSVA in the two subgroups. (F) Boxplot of the abundance of immune cells in the two subgroups. **p < 0.01, ***p < 0.001.
Selection of key CRs genes
The PPI network of prognostic-related CRs genes were shown in Figure 3A, with the help of the String database analysis and Cytoscape software, direct or indirect functional interactions of proteins were visualized, and core genes were specifically marked (the darker the red color, the higher the number of nodes). The names and number of nodes of the key genes are shown in Figure 3B, and these 40 genes were defined as key CRs genes for subsequent study analysis.
FIGURE 3
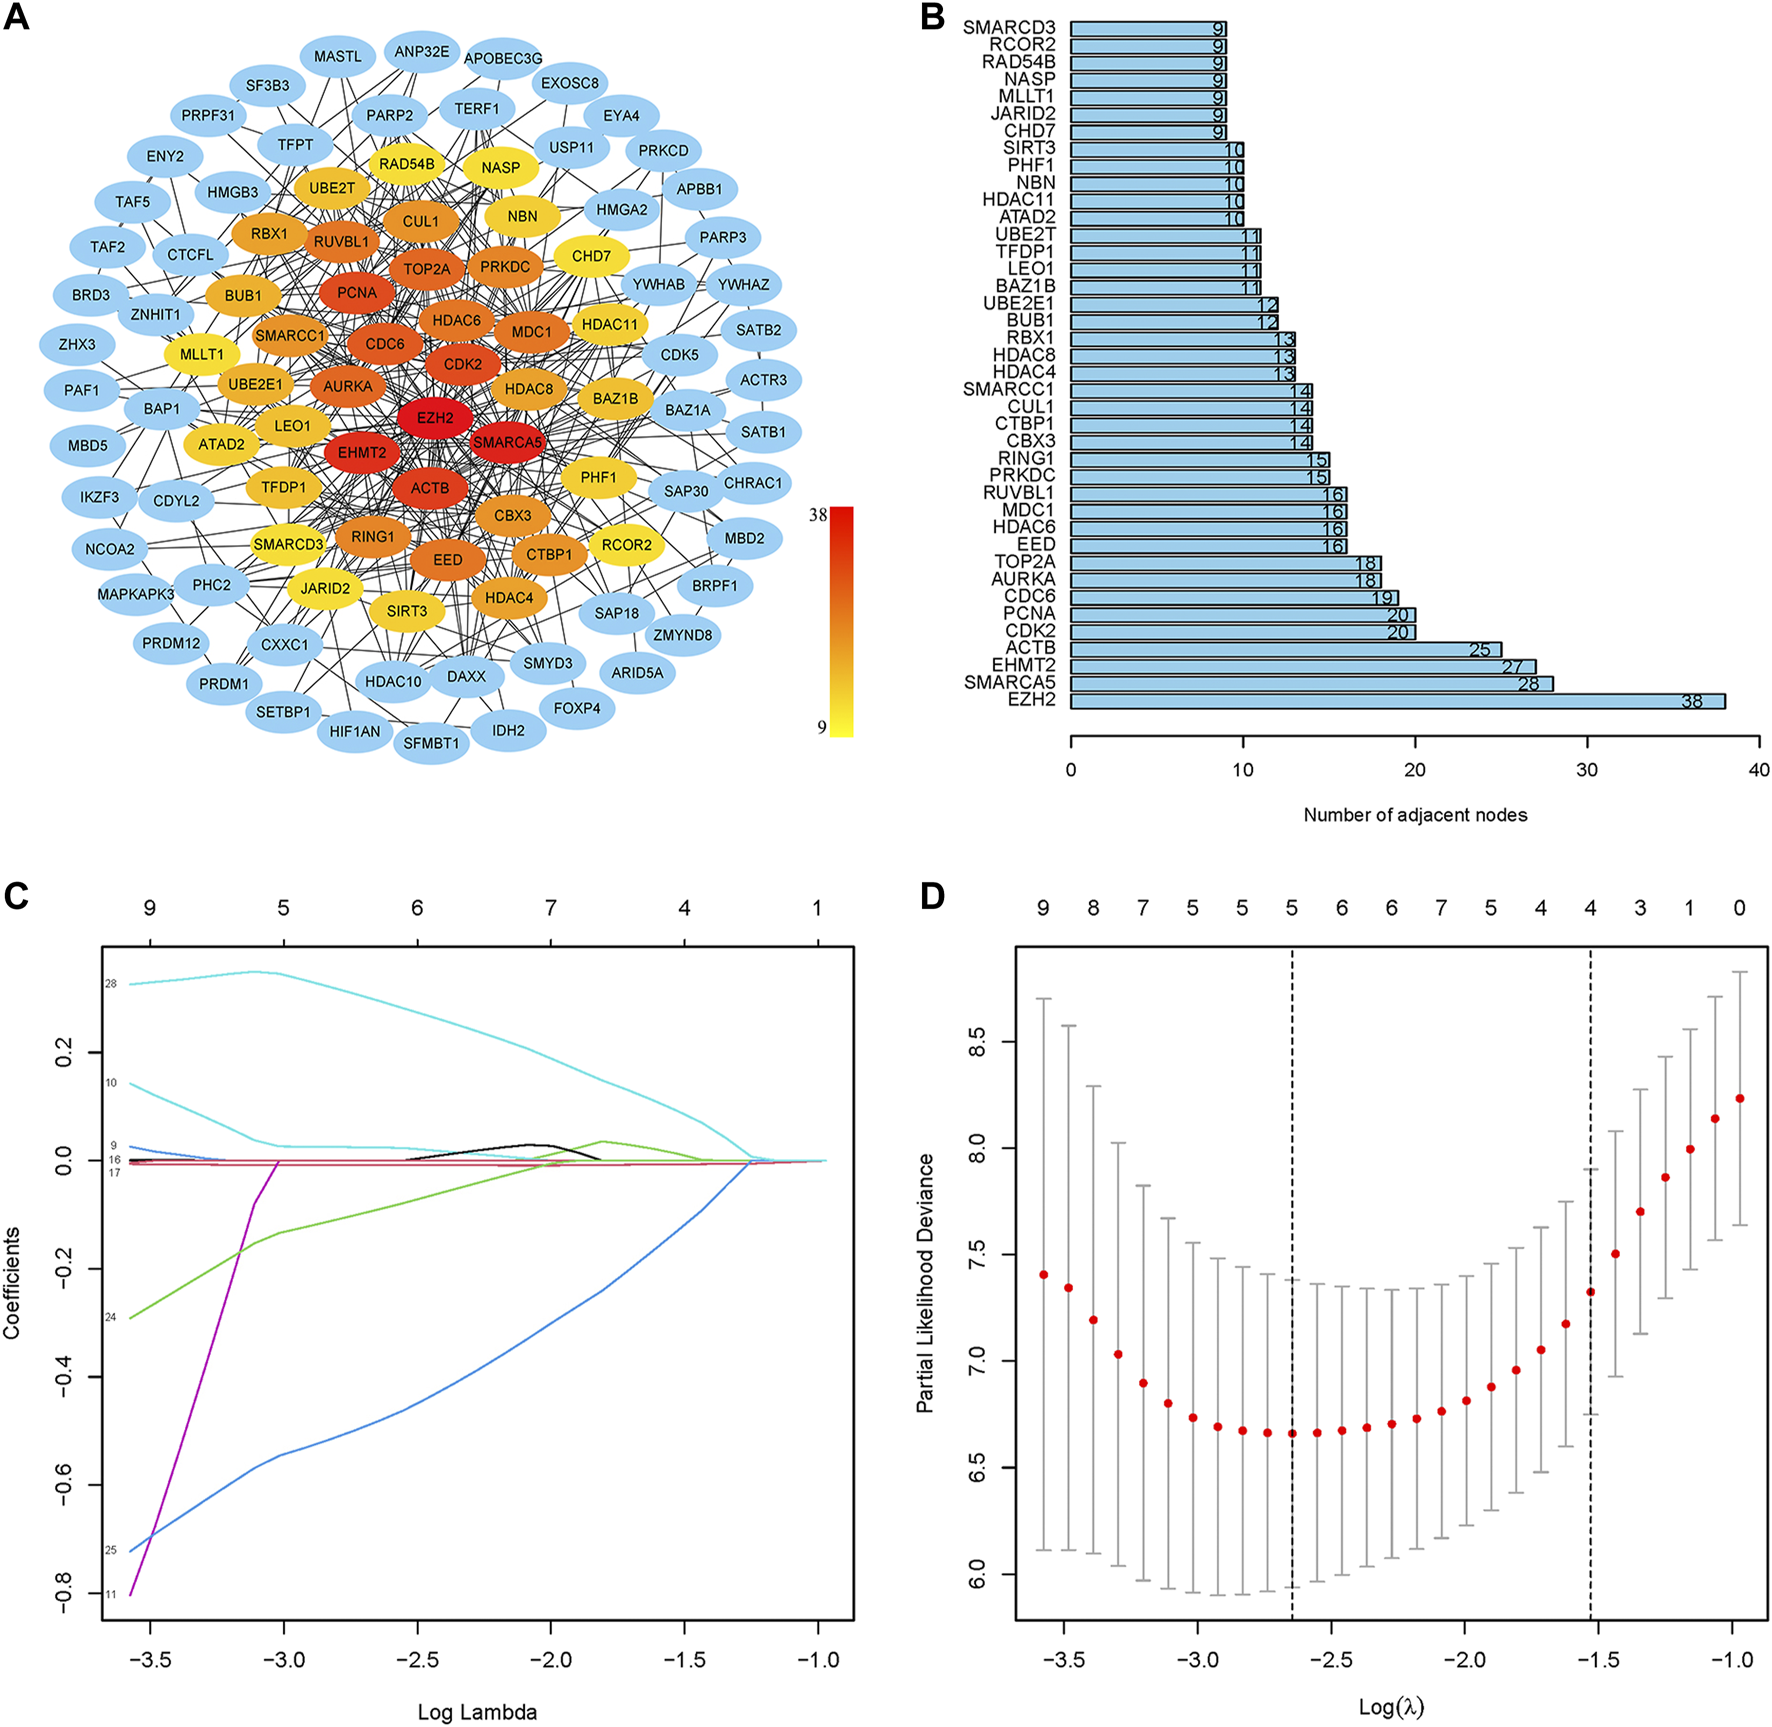
Screening of key CRs genes and construction of risk model. (A) The PPI network of prognostic CRs genes. (B) The names and number of nodes of the top 40 genes in the PPI network. (C) Coefficient curve. Different colors represent different genes. (D) The minimum lambda value of the lasso model, λ = 5, was determined at the minimum deviation from the partial likelihood, and five genes were available for the analysis.
Establishment and validation of CRs-based signature risk model
First, the random grouping of the TCGA training and test groups was reasonable, with no bias in the selection of clinical traits (p > 0.05). Statistical data of each group are shown in Table 2. Then, LASSO regression analysis successfully screened out 5 CRs including CDK2, CUL1, RUVBL1, SIRT3, SMARCD3, and multifactorial Cox analysis was performed on these 5 genes (Figures 3C, D), and finally, a risk model consisting of 3 genes (RUVBL1, SIRT3, and SMARCD3) were successfully constructed (Table 3).
TABLE 2
| Covariates | Type | Training group | Testing group | Total group | p-value |
|---|---|---|---|---|---|
| Age | ≤65 | 33 (58.93%) | 13 (54.17%) | 46 (57.5%) | 0.8823 |
| >65 | 23 (41.07%) | 11 (45.83%) | 34 (42.5%) | ||
| Gender | Female | 23 (41.07%) | 12 (50%) | 35 (43.75%) | 0.6229 |
| Male | 33 (58.93%) | 12 (50%) | 45 (56.25%) | ||
| Stage | Stage II | 28 (50%) | 8 (33.33%) | 36 (45%) | 0.0975 |
| Stage III | 24 (42.86%) | 16 (66.67%) | 40 (50%) | ||
| Stage IV | 4 (7.14%) | 0 (0%) | 4 (5%) | ||
| M | M0 | 50 (89.29%) | 23 (95.83%) | 73 (91.25%) | 0.4047 |
| M1 | 4 (7.14%) | 0 (0%) | 4 (5%) | ||
| Unknown | 2 (3.57%) | 1 (4.17%) | 3 (3.75%) | ||
| N | N0 | 53 (94.64%) | 23 (95.83%) | 76 (95%) | 1 |
| Unknown | 3 (5.36%) | 1 (4.17%) | 4 (5%) | ||
| T | T2 | 5 (8.93%) | 0 (0%) | 5 (6.25%) | 0.3081 |
| T3 | 25 (44.64%) | 11 (45.83%) | 36 (45%) | ||
| T4 | 26 (46.43%) | 13 (54.17%) | 39 (48.75%) |
Statistical analysis of clinical features of a randomized grouping of TCGA dataset.
TABLE 3
| Gene symbol | Full name | Risk coefficient |
|---|---|---|
| RUVBL1 | RuvB-like AAA ATPase 1 | −0.52462896083222 |
| SIRT3 | Sirt3, Silent Mating Type Information Regulation 2 Homolog 3 | −1.12003130376948 |
| SMARCD3 | BAF60C/SWI-SNF related, matrix associated, actin dependent regulator of chromatin, subfamily d, member 3 protein | 0.837694828472529 |
Genes in the prognostic signatures of the risk model.
Risk score = (−0.52462896083222 × RUVBL1 expression) + (−1.12003130376948 × SIRT3 expression) + (0.837694828472529 × SMARCD3 expression).
The median risk score (1.324375242) of the TCGA training group was used as the threshold to distinguish the high-risk group from the low-risk group. Based on the grouping, a total of five cohorts were available for assessing and validating the prognostic value of the model in this study, including the TCGA training group (N = 56), the TCGA testing group (N = 24), the TCGA all group (N = 80) and two independent datasets GSE22138 (N = 63) and GSE84976 (N = 28).
Validation of the risk model
The results of Kaplan-Meier survival curves for all datasets are shown in Figures 4A–F, patients with a high-risk score tended to have a lower survival probability and die (or metastasis) earlier than those with a low-risk score. The AUC values for the rest of the dataset exceeded 0.7, except for the 1-year and 5-year AUC values of 0.655 for GSE22138. The results suggest that our risk model has a good predictive effect on the prognosis of UM patients.
FIGURE 4
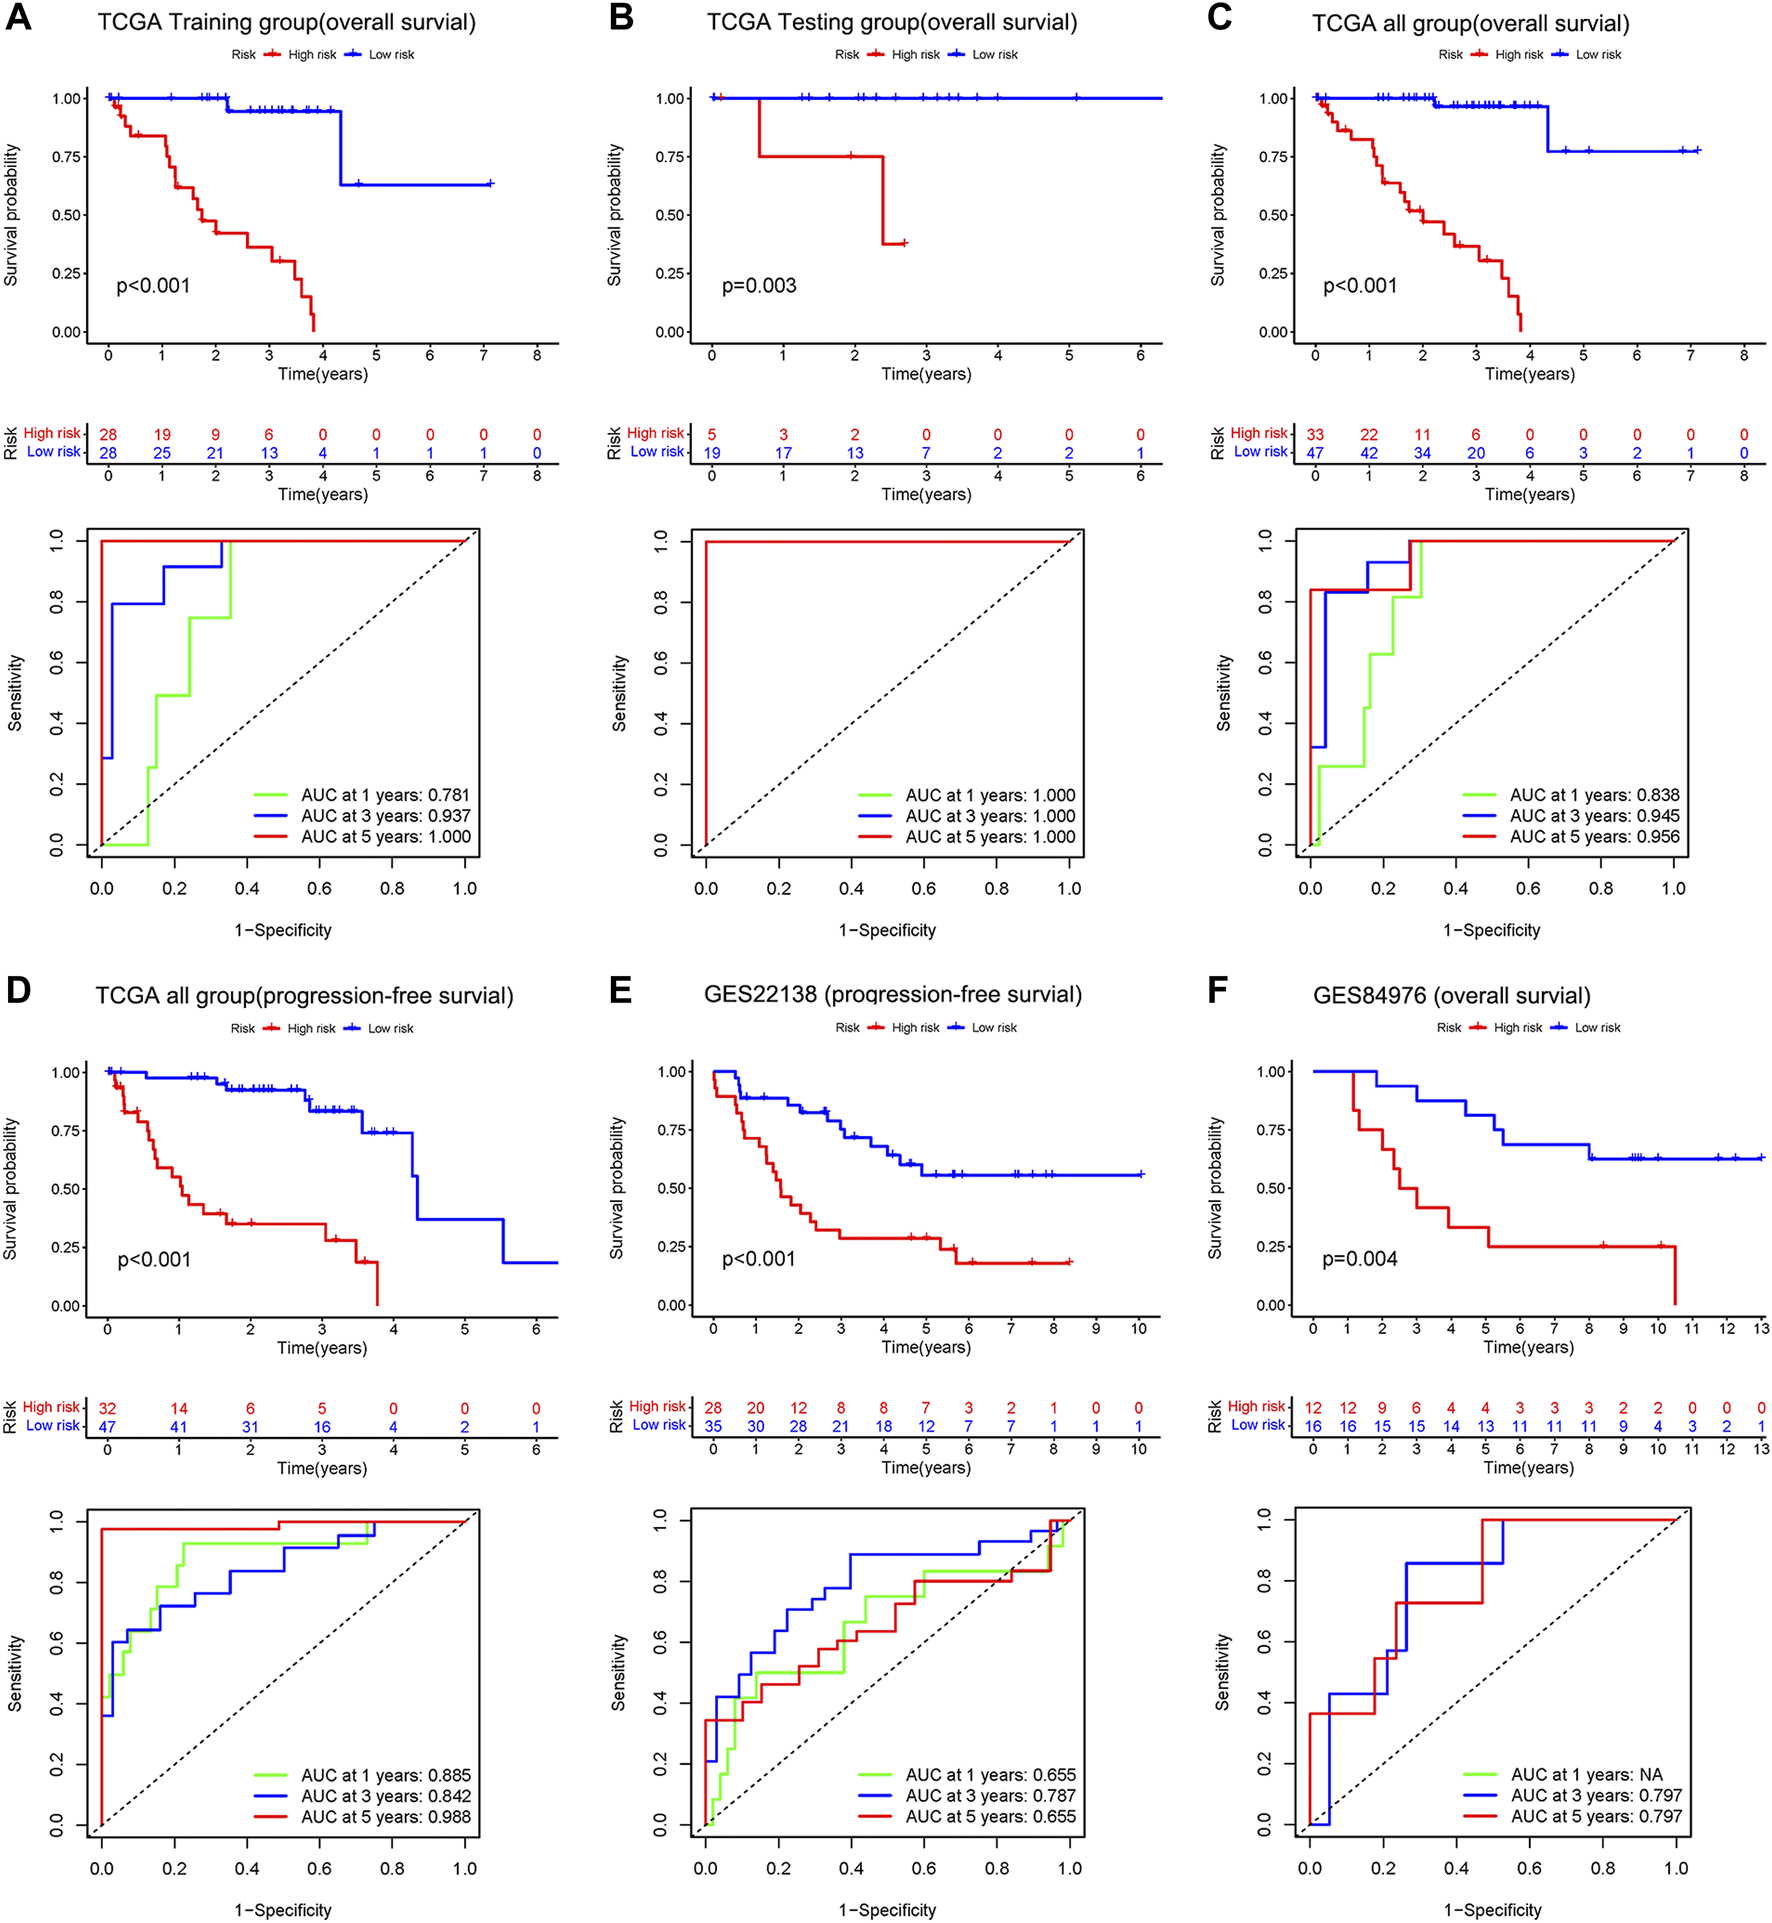
Upper: Kaplan–Meier survival analyses based on the risk model. Bottom: 1 -, 3-, and 5-year ROC analyses based on the risk model. Overall survival of patients in the TCGA training group (A), the internal validation group of the TCGA testing group (B), the entire TCGA dataset (C), and the independent dataset GSE84976 (F). Progression-free survival of patients in TCGA dataset (D) and the independent dataset GSE22138 (E).
In the 3-year ROC curves, the AUC values for risk scores were greater than those for other clinical traits, suggesting that the use of risk scores predicted the survival of UM patients better than other clinical traits (Figure 5A). Furthermore, we developed a prognostic nomogram for estimating the UM patients’ survival likelihood (Figure 5B). This prognostic nomogram could systematically anticipate the 1-, 2-, and 3-year OS of UM patients. The calibration curve showed that actual results were consistent with predicted results (Figure 5C).
FIGURE 5
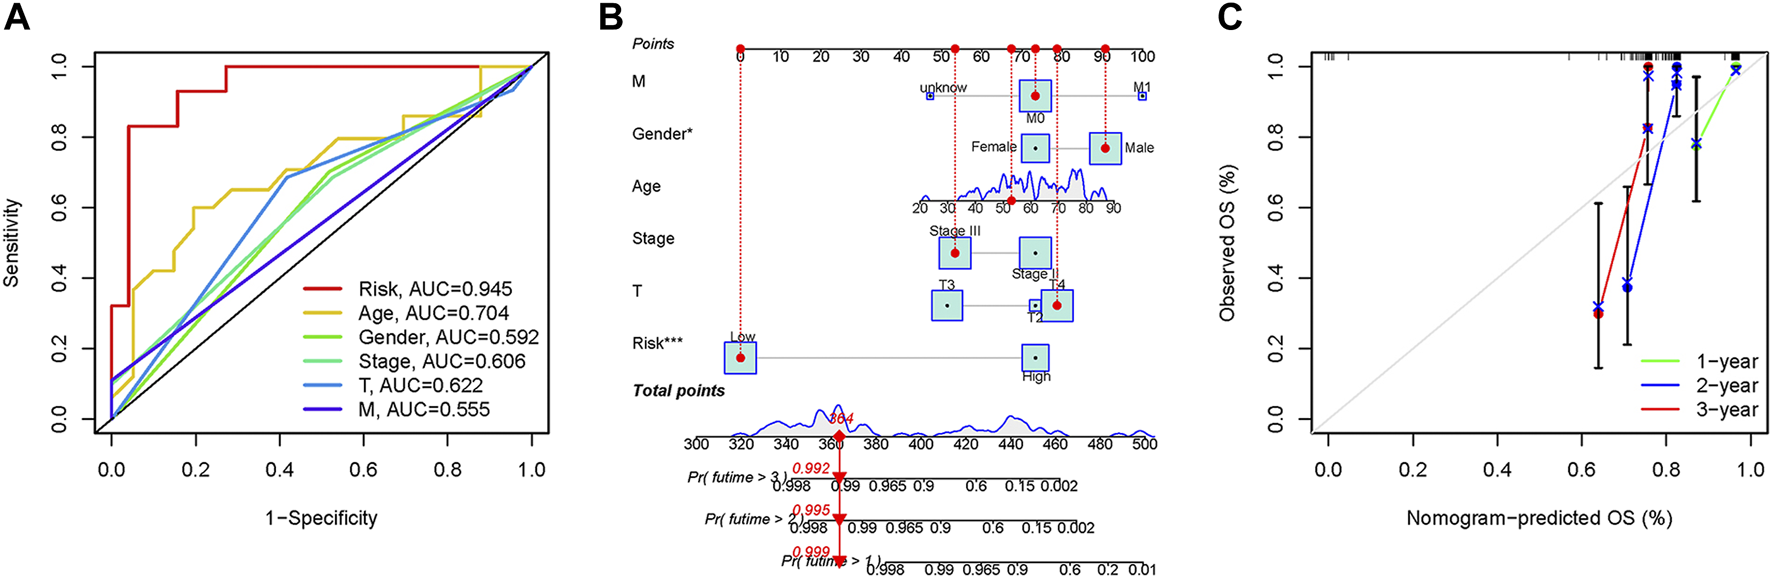
Prognostic assessment efficiency comparison of the ROC curve and construction of the nomogram based on risk score and clinical factors. (A) ROC curve analysis at 3 years. (B) The nomogram to predict the 1-, 2- and 3-year survival risk of UM patients. (C) Calibration curve for the 1-, 2-, and 3-year predicted survival nomogram. *p < 0.05, ***p < 0.001.
Gene set variation analysis
The GSVA results displayed in Figure 6A, the high-risk group genes are enriched in ABC transporters, apoptosis, RIG-I-like receptor signaling pathway, cell-cytokine receptor interaction, glucose metabolism, pyrimidine metabolism, and sulfur metabolism pathways. These pathways are closely associated with tumor development, and the ABC transporters were closely related to the multidrug resistance (MDR) of the tumor.
FIGURE 6
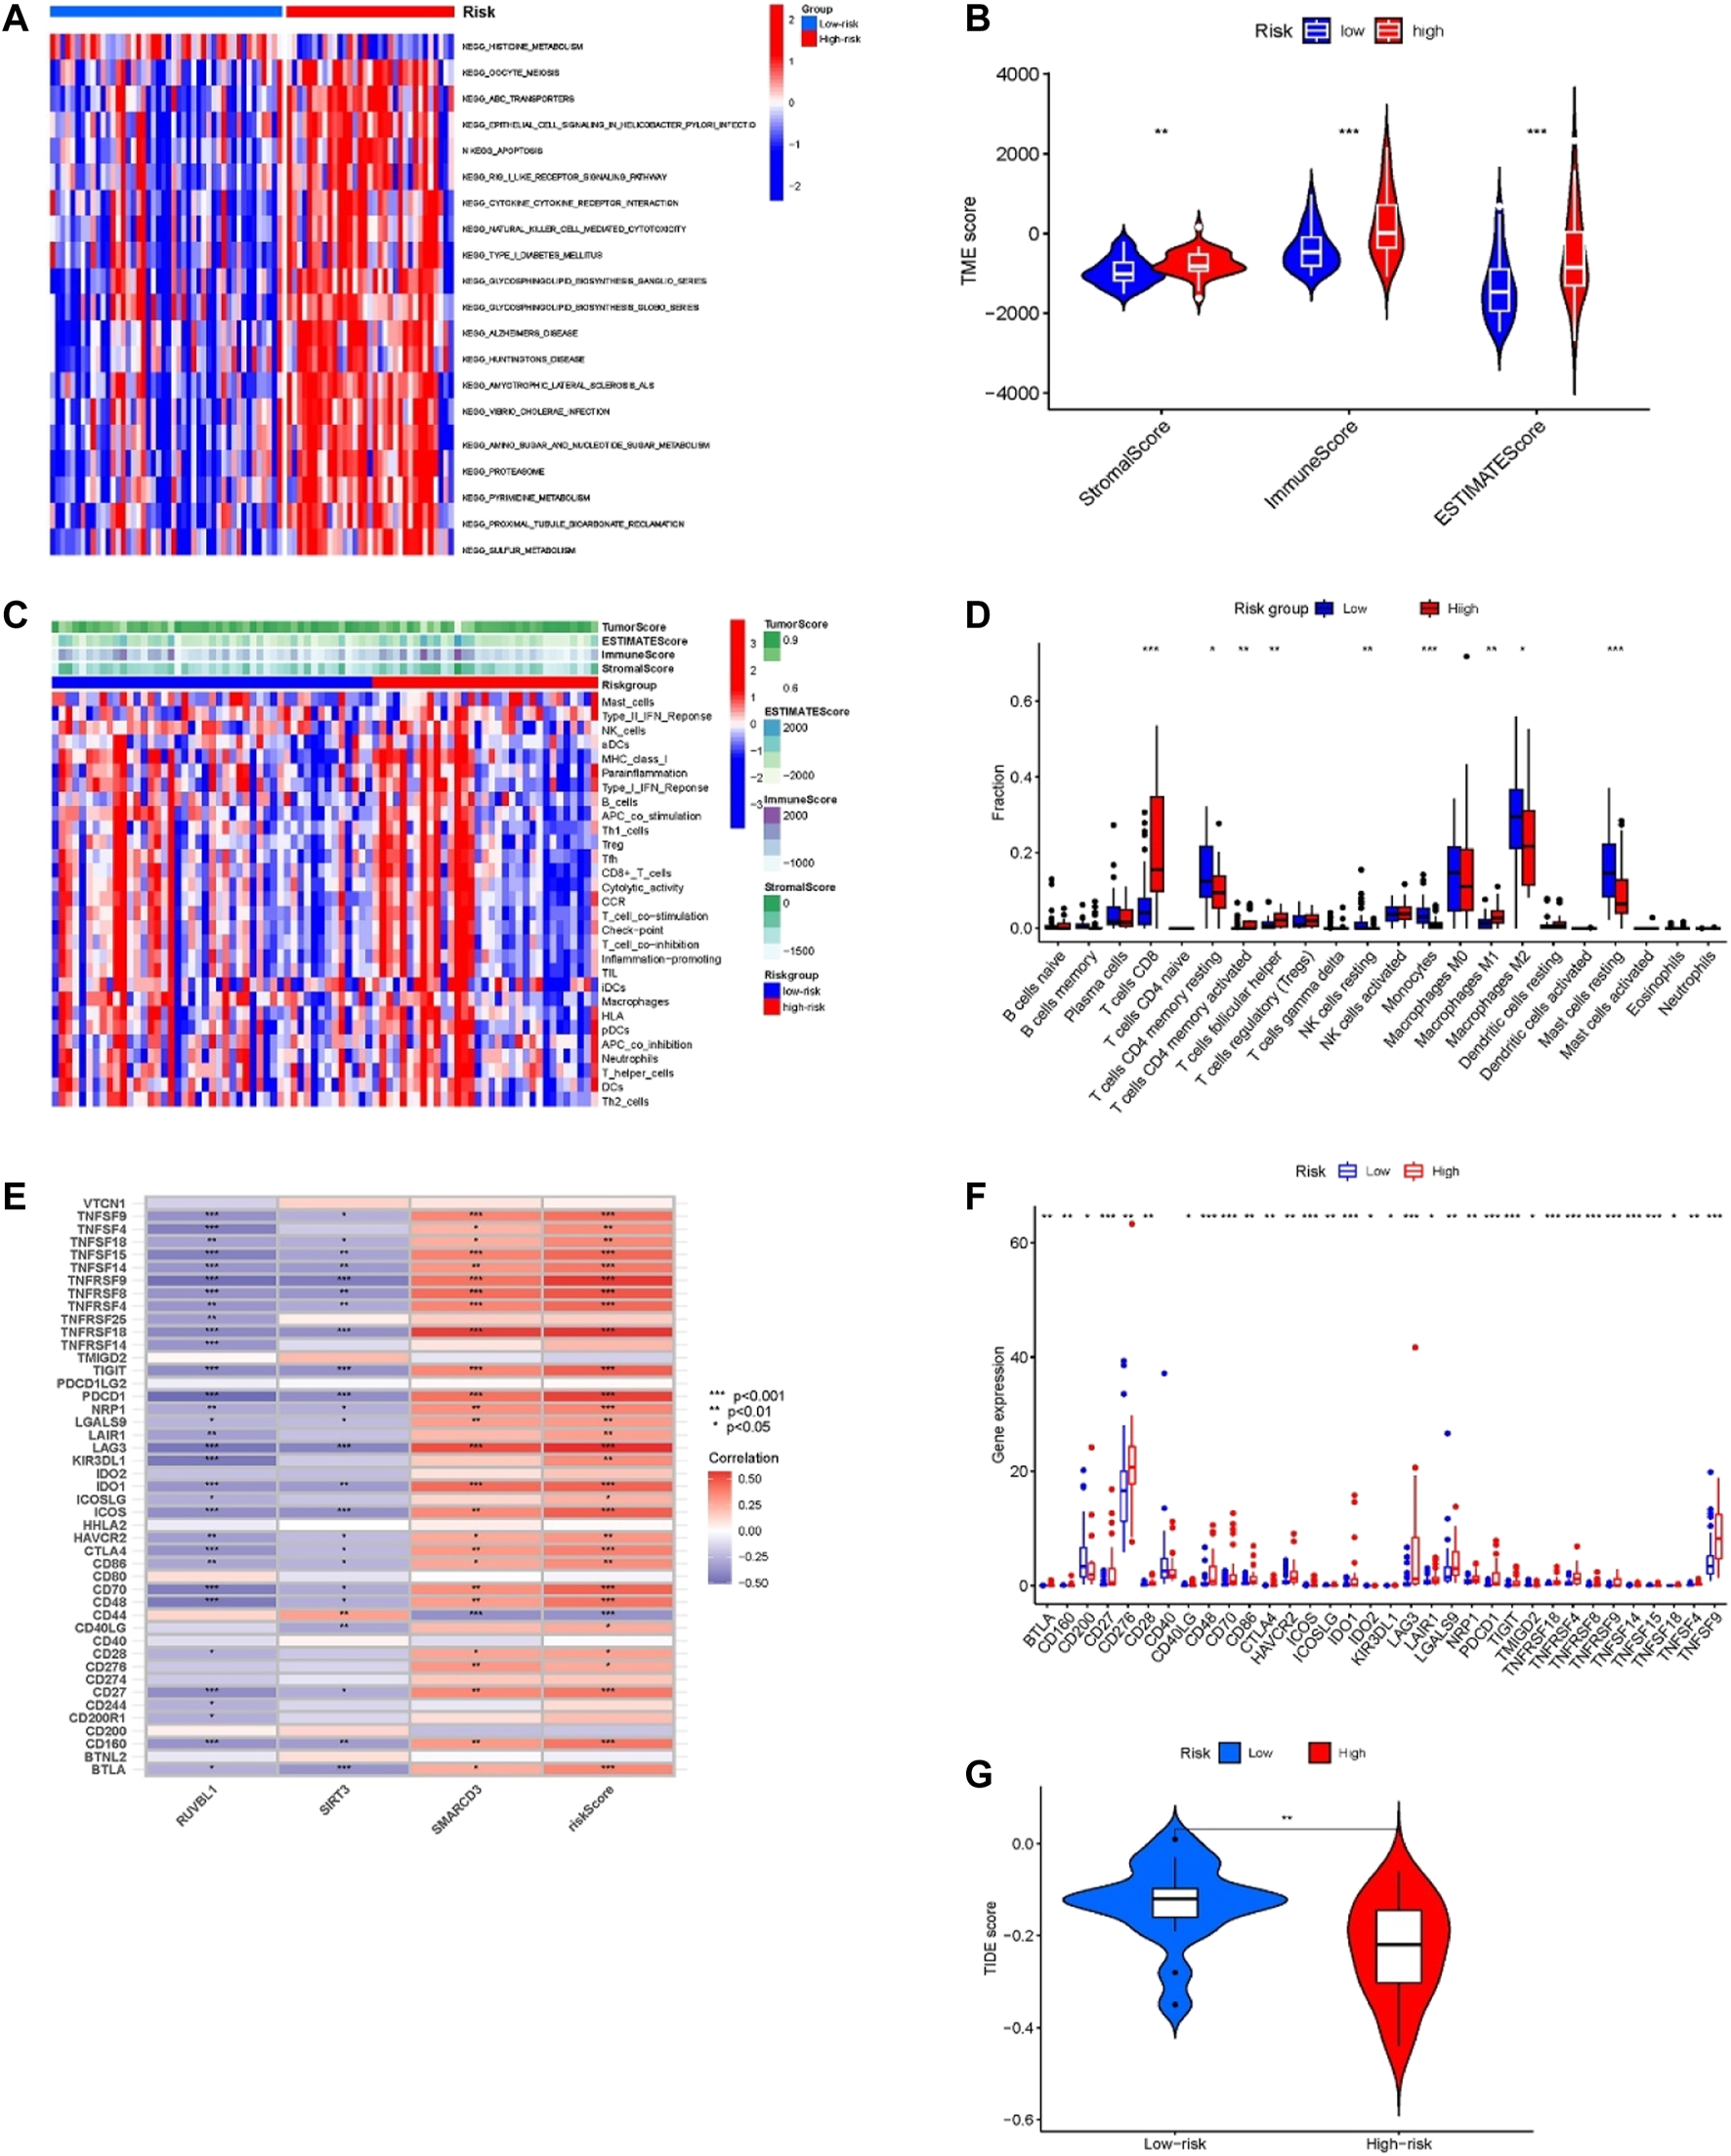
Tumor microenvironment and immune-related analysis in two groups. (A) KEGG pathway analyses of GSVA in the two groups. (B) Difference analysis of TME scores in two groups. (C) The ssGSEA analysis of the immune cell infiltration level in the two subgroups. (D) Comparison of immune cell infiltration in two groups. (E) Correlation of risk score and 3 risk model-related genes with the expression of immune checkpoints. (F) Comparison of the expression of immune checkpoints in two groups. (G) Difference analysis of TIDE score in two groups. *p < 0.05, **p < 0.01, ***p < 0.001.
Tumor microenvironment and immune-correlation analysis of the model
For confirming if the risk model was associated with tumor microenvironment and tumor immunity, we analyzed the differences in TME scoring, immune cells, and immune checkpoint gene expression between the two groups. As shown in Figure 6B, the results of the ESTIMATE analysis showed that the TME-related scores of the high-risk group were higher than those of the low-risk group. Moreover, we used the ssGSEA method for evaluating differences in immune cell infiltration between the two groups. The heatmap of immune cell expression is shown in Figure 6C, and the different analysis results are shown in Figure 6D. As Figure 6D indicates, the expression of T cells CD8, T cells CD4 memory resting, T cells CD4 memory activated, T cells follicular helper, NK cells resting, Monocytes, Macrophages M1, Macrophages M2 and Mast cells resting had significant differences between the two groups. Among them, within the high-risk group, T cells CD8, T cells CD4 memory activated, T cells follicular helper, and Macrophages M1 proportion were significantly increased, while the opposite results occurred in T cells CD4 memory resting, NK cells resting, Monocytes, Macrophages M2, and Mast cells resting proportions. Additionally, the results of correlation analysis demonstrated that the risk score and the expression of SMARCD3 were positively correlated with the expression of many immune checkpoints (Figure 6E), and as Figure 6F indicates, significant differences were found in immune checkpoint expression. Many immune checkpoints were upregulated in high-risk subgroups, such as PDCD1/PD-L1, BLTA, CTLA4, LAG3, CD276, TNFRSF25, IDO1, SIGLEC7, TIGIT, LILRB2, and so on. Moreover, the TIDE score of the high-risk group was significantly lower than that of the low-risk group (p < 0.01) (Figure 6G), which suggested that patients in the high-risk group may have a better response to immune checkpoint blockade (ICB) treatment.
Analysis of signature genes in the risk model
First, we found the distribution and relationship of two subgroups, two risk groups, and two clinical outcomes (Figure 7A). And statistical and consistency analysis was performed on 80 UM patients in TCGA for subtypes and risk groupings, and the results were presented as a 2 × 2 contingency table (Supplementary Table S3), and the result of the consistency test Kappa coefficient (κ = 0.691) showed a substantial consistency in the classification of UM samples by tumor subtypes and risk groupings. We found a significant difference between the two subgroups in risk score (Figure 7B). Additionally, the relative expression of the signature gene SMARCD3 was higher in the poor prognosis group (C2 and high-risk group), and RUVBL1 expression in the better prognosis group (C1 and low-risk group) in the three datasets, but the SIRT3 expression was higher in the TCGA subtype and the group with good prognosis in the dataset GSE22138, while no difference was found in the risk group of the dataset GSE84976 (Figures 7C–E). Interestingly, the difference analysis results of the three signature genes between the group’s metastasis and non-metastasis in data set GSE22138 are shown in Figure 7F, the SMARCD3 expression is different, and the expression is higher in the group with metastasis. Moreover, the lower RUVBL1 and SIRT3 expressions were significantly correlated with poor survival probability (Figures 8A–C, E–G), and the higher expression of SMARCD3 was significantly correlated with poor survival probability (Figures 8I–L). Notably, RUVBL1 and SIRT3 expressions were not associated with progression-free survival in dataset 22138 (Figures 8D, H). These results suggest that the SMARCD3 gene may be closely associated with the progression of UM.
FIGURE 7
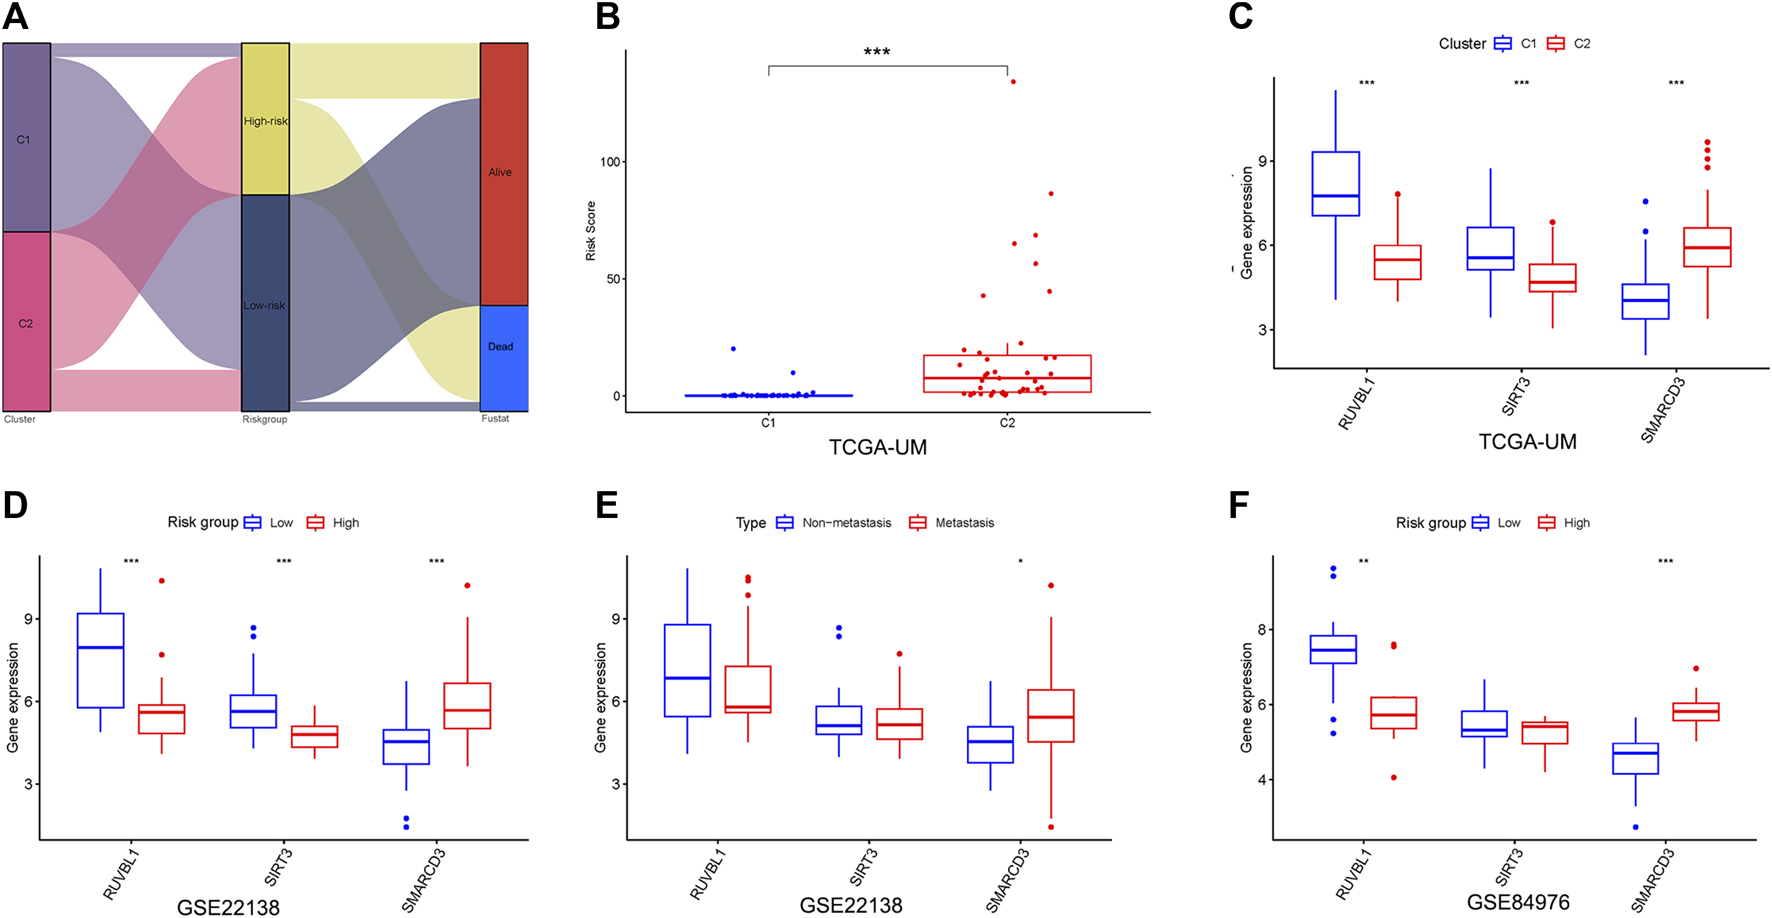
Analysis of signature genes in the risk model. (A) Sankey diagram of the two subgroups, two risk groups, and two clinical outcomes. (B) Differences in the risk scores between the two subgroups. (C) Differential expression of three signature genes in subtypes. (D,E) Differential expression of three signature genes in risk groupings for datasets GSE22138 and GSE84976. (F) Differential expression of three signature genes in the metastasis subgroup of GSE22138. *p < 0.05, **p < 0.01, ***p < 0.001.
FIGURE 8
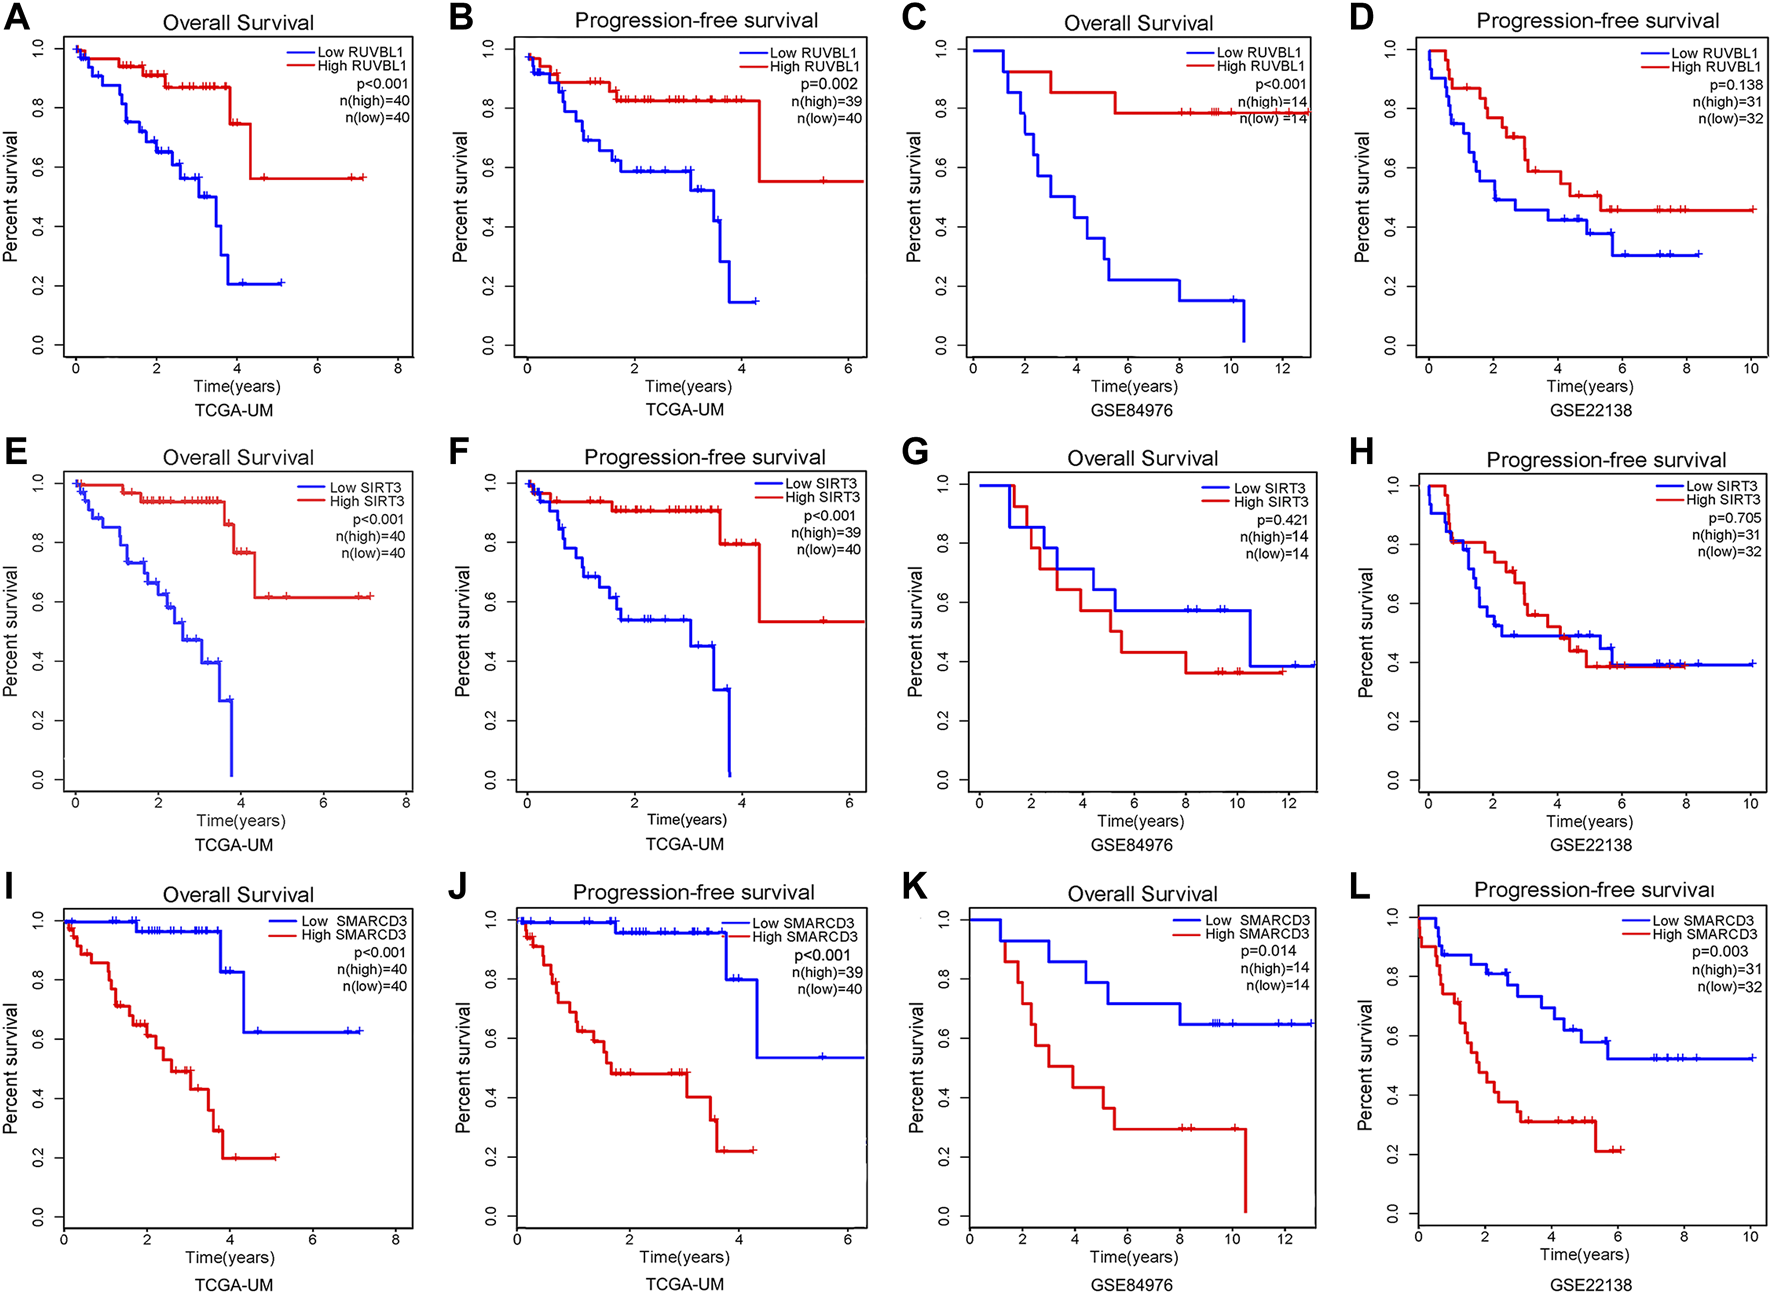
Survival analysis of signature genes in the risk model. Red represents patients in the high gene expression group and blue represents patients in the low-risk group. The x-axis represents the survival time and the y-axis represents the survival rate. (A–D) Survival analysis of OS and PFS in the RUVBL1 expression subgroup. (E–H) Survival analysis of OS and PFS in the SIRT3 expression subgroup. (I–L) Survival analysis of OS and PFS in the SMARCD3 expression subgroup.
Discussion
UM is the most common primary malignant intraocular tumor in adults and is characterized by high mortality (>95%), high metastasis (>50%), and poor prognosis within 5 years, making the search for effective biomarkers for accurate diagnosis, assessing prognosis and guiding treatment crucial [44]. CRs play various roles in tumorigenesis. It is a diagnostic and prognostic marker for many cancers [45–50].
In this study, we synthesized and analyzed the UM dataset collected from TCGA and GEO and developed a risk model for UM prognosis consisting of 3 CRs. Unlike other tumors, the UM dataset lacks normal tissue, and we used the NMF method to classify UM patients into two subtypes. The results of the survival analysis showed significant differences in overall survival and progression-free survival between the two subtypes. The results confirm that the expression of prognosis-related CRs based on the prognosis helps to identify UM subtypes. We obtained a risk model by the LASSO Cox regression model before which we improved the generalization ability of the model by preventing “overfitting” by randomly grouping the TCGA dataset. The survival analysis of the model was statistically significant in both the training and validation cohorts. The results of ROC curves comparing risk scores with other clinical traits for prognosis prediction of UM also confirmed the better prediction accuracy of the risk model, while the nomogram constructed based on clinical characteristics and risk scores could systematically predict OS of UM patients.
We further analyzed the TME and immune cell infiltration differences in subtypes and risk subgroups. Immune cells and stromal cells are the two major non-tumor components of the TME, and the ratio of these two cells has an important impact on tumor prognosis. ESTIMATE (Estimation of STromal and Immune cells in MAlignant Tumour tissues using Expression data) was calculated by analyzing transcriptional data from cancer samples to calculate the proportion of relevant immune, stromal, and tumor cells in the TME [51]. In our study, stromal score, immune score, and ESTIMATE score were significantly higher in the poor prognosis groups than in the better prognosis groups, suggesting that the prognosis of UM was associated with non-tumor cell infiltration. It has been demonstrated that the poor prognosis of UM is positively correlated with immune cell infiltration [52], so we further analyzed the differences in immune cell infiltration. The infiltration of T-cell CD8, T-cell CD4 memory activation, T-cell follicular helper cells, and macrophages was higher in the poorer prognosis group (C2 and high-risk group) than in the better prognosis group (C1 and low-risk group). These types of immune cells were also closely associated with tumor development. For example, CD8+ T cells themselves can selectively detect and eradicate cancer cells, but tumors continue to develop when they coexist with tumor cells, which is associated with dysfunctional tumor-responsive CD8+ T cells [53]. Accumulation of T follicular helper (Tfh) cells has positive or negative prognostic effects in different human cancers. In melanoma, Tfh cells exert an immunosuppressive function and suppress the function of CD8+ T cells. Additional studies have shown that high Tfh levels are associated with an increase in CD8+ T cells and that CD8+/Tfh crosstalk plays an important role in shaping the antitumor immune response generated by immunotherapy [54–56]. Infiltration of CD4 memory-activated T cells may be a poor prognostic factor in many cancers [57–60]. In cutaneous melanoma, high infiltration of CD4 memory-activated T cells promotes melanoma metastasis [61]. Macrophages play an important role in tumorigenesis and metastasis [62, 63]. In uveal melanoma, macrophages are a negative prognostic factor for it [64]. The mechanisms by which they influence the progression and prognosis of UM need further investigation. In addition, we performed a TIDE analysis between the high- and low-risk groups. Tumor immune dysfunction and rejection (TIDE) is a computational framework for identifying factors underlying both mechanisms of tumor immune escape, which include, in some tumors, high levels of cytotoxic T-cell infiltration but dysfunction of these T cells, and in other tumors, immunosuppressive factors that may preclude T-cell infiltration of the tumor [65–67]. The TIDE score can predict the immune checkpoint suppression efficacy, and the results of the TIDE score will better help physicians to select patients more suitable for immune checkpoint blockade (ICB) therapy [68]. Our study showed that the TIDE score was significantly lower in the high-risk group than in the low-risk group, which also suggests that patients in the high-risk group may be more effective when receiving ICB therapy. Many immune checkpoint genes expression was higher in the high-risk group with a poorer prognosis, and we showed significant correlations between risk model scores and three signature genes and many immune checkpoint genes expression, which also suggests that patients in the high-risk group may be more effective when treated with immune checkpoint blockade.
Our risk model consisted of RUVBL1, SIRT3, and SMARCD3. These three genes have also been reported several times in previous studies to play a role in the development of tumors. Sirtuin 3(SIRT3)is the most talked about Sirtuin family member in recent times (a family of NAD+-dependent deacetylases that regulate signaling pathways involved in cellular proliferation and differentiation, metabolism, response to stress, and cancer. Recent studies have pointed out that SIRT3 is a critical regulator of cell metabolism and played a dual role in cancer, as it can act as a suppressor or promoter in a variety of tumors [69], such as breast cancer, colon cancer, and prostate cancer [70–76]. Our findings suggest that SIRT3 may act as a protective factor in the development of uveal melanoma, which is similar to previous findings [77]. However, the specific role and molecular mechanisms of SIRT3 in UM have not been reported. SMARCD3 (SWI-SNF-associated, matrix-associated, actin-dependent regulator of chromatin, subfamily d, member 3 protein) is an important member of the SWI/SNF chromatin remodeling complex, has a role in regulating gene expression [78, 79]. Previous studies have confirmed that SMARCD3 has a cancer-promoting effect in ER+ breast cancer [80, 81]. The results of the related bioinformatic analysis also suggested that SMARCD3 was a prognostic and potential treatment target maker for colorectal cancer, neuroblastoma, hematologic malignancy, and uveal melanoma [82–85]. RUVBL1 belongs to the AAA+ superfamily of ATPases and plays an important role in many cellular activities [86]. It has been widely reported as an oncogenic factor. For example, it can accelerate the progression of lung cancer by activating the RAF/MEK/ERK pathway, and the high expression of RUVBL1 in mammary carcinoma suggests a worse prognosis [87, 88]. However, a recent study found that a decrease in RUVBL1 promoted the progression of hepatocellular carcinoma [89]. In our study, SMARCD3 expression was negatively correlated with prognosis. OS and PFS were significantly different between high and low expression groups, while SMARCD3 expression levels differed both between subtypes and between risk subgroups, with higher SMARCD3 expression levels in the poorer prognosis group and higher SMARCD3 expression levels in the metastatic group in dataset GSE22138. The expression of SIRT3 and RUVBL1 was positively correlated with prognosis, with differential and survival analyses showing opposite trends to SMARCD3. These results also suggest that SMARCD3 may play a facilitating role in UM progression, while SIRT3 and RUVBL1 play a protective role. This of course requires further experiments to verify.
Notably, we pioneered the construction of a risk model consisting of three CRs genes that can predict the prognosis of UM. Our risk model consists of only three genes, which reduces the cost of clinical testing and improves the possibility of clinical application. Our research offers new insight into the projection of UM but still has some limitations. First, the sample data in this study were from predominantly white Western countries, and there may be genetic inheritance differences. Second, the lack of normal or paracancerous tissues compared with tumor tissues made it impossible to observe the expression of the three characteristic genes in normal and tumor tissues, which needs to be demonstrated with more samples. In addition, all three genes included in our risk model are involved in tumor biological processes. However, the mechanism of how these CRs regulate the biological behavior of UM cells needs to be validated experimentally.
Conclusion
In conclusion, we successfully constructed a risk model consisting of only three signature chromatin regulators that are valuable in predicting the prognosis of uveal melanoma patients. In addition, the model interacts closely with the tumor immune environment and TIDE score results, which may facilitate the development of new therapies for uveal melanoma treatment.
Statements
Data availability statement
The data in this study are publicly available, and readers can request them by contacting the corresponding author’s email address.
Author contributions
YL: as the first author of the study, performed all the data analysis and wrote the manuscript. CX, LW, BZ, SW, YC, and QX: responsible for collating research results and editing pictures. HL: as the instructor of this study, participated in the whole process of the study. All authors contributed to the article and approved the submitted version.
Funding
This work was supported by grants from the General Project of the Education Department of Jiangxi Province, China (No. GJJ210201).
Conflict of interest
The authors declare that the research was conducted in the absence of any commercial or financial relationships that could be construed as a potential conflict of interest.
Supplementary material
The Supplementary Material for this article can be found online at: https://www.por-journal.com/articles/10.3389/pore.2023.1610980/full#supplementary-material
References
1.
KaurJMalikMAGulatiRAzadSVGoswamiS. Genetic determinants of uveal melanoma. Tumour Biol (2014) 35:11711–7. 10.1007/s13277-014-2681-7
2.
KalikiSShieldsCL. Uveal melanoma: Relatively rare but deadly cancer. Eye (2016) 31(2):241–57. 10.1038/eye.2016.275
3.
HoiomVHelgadottirH. The genetics of uveal melanoma: Current insights. Appl Clin Genet (2016) 9:147–55. 10.2147/tacg.s69210
4.
AugsburgerJJCorrêaZMShaikhAH. Effectiveness of treatments for metastatic uveal melanoma. Am J Ophthalmol (2009) 148(1):119–27. 10.1016/j.ajo.2009.01.023
5.
RietschelPPanageasKSHanlonCPatelAAbramsonDHChapmanPB. Variates of survival in metastatic uveal melanoma. J Clin Oncol (2005) 23(31):8076–80. 10.1200/jco.2005.02.6534
6.
PatroneSMaricIRutiglianiMLanzaFPuntoniMBanelliBet alPrognostic value of chromosomal imbalances, gene mutations, and BAP1 expression in uveal melanoma. Genes, Chromosomes, and Cancer (2018) 57(8):387–400. 10.1002/gcc.22541
7.
DamatoB. Ocular treatment of choroidal melanoma in relation to the prevention of metastatic death – a personal view. Prog Retin Eye Res (2018) 66:187–99. 10.1016/j.preteyeres.2018.03.004
8.
SmitKNJagerMJde KleinAKiliҫE. Uveal melanoma: Towards a molecular understanding. Prog Retin Eye Res (2020) 75:100800. 10.1016/j.preteyeres.2019.100800
9.
OnkenMDWorleyLAEhlersJPHarbourJW. Gene expression profiling in uveal melanoma reveals two molecular classes and predicts metastatic death. Cancer Res (2004) 64(20):7205–9. 10.1158/0008-5472.CAN-04-1750
10.
JagerMJBrouwerNJEsmaeliB. The cancer genome Atlas Project: An integrated molecular view of uveal melanoma. Ophthalmology (2018) 125(8):1139–42. 10.1016/j.ophtha.2018.03.011
11.
BolKFvan den BoschTSchreibeltGMensinkHWKeunenJEEKiliçEet alAdjuvant dendritic cell vaccination in high-risk uveal melanoma. Ophthalmology (2016) 123(10):2265–7. 10.1016/j.ophtha.2016.06.027
12.
VerdegaalEM. Adoptive cell therapy: A highly successful individualized therapy for melanoma with great potential for other malignancies. Curr Opin Immunol (2016) 39:90–5. 10.1016/j.coi.2016.01.004
13.
LarkinJChiarion-SileniVGonzalezRGrobJJCoweyCLLaoCDet alCombined nivolumab and ipilimumab or monotherapy in untreated melanoma. New Engl J Med (2015) 373(1):23–34. 10.1056/nejmoa1504030
14.
WeberJSD’AngeloSPMinorDHodiFSGutzmerRNeynsBet alNivolumab versus chemotherapy in patients with advanced melanoma who progressed after anti-CTLA-4 treatment (CheckMate 037): A randomised, controlled, open-label, phase 3 trial. Lancet Oncol (2015) 16(4):375–84. 10.1016/s1470-2045(15)70076-8
15.
HodiFSO’DaySJMcDermottDFWeberRWSosmanJAHaanenJBet alImproved survival with ipilimumab in patients with metastatic melanoma. New Engl J Med (2010) 363(8):711–23. 10.1056/nejmoa1003466
16.
XueMShangJChenBYangZSongQSunXet alIdentification of prognostic signatures for predicting the overall survival of uveal melanoma patients. J Cancer (2019) 10(20):4921–31. 10.7150/jca.30618
17.
WanQTangJLuJJinLSuYWangSet alSix-gene-based prognostic model predicts overall survival in patients with uveal melanoma. Cancer Biomarkers (2020) 27(3):343–56. 10.3233/cbm-190825
18.
LiYYangXYangJWangHWeiW. An 11‐gene‐based prognostic signature for uveal melanoma metastasis based on gene expression and DNA methylation profile. J Cell Biochem (2018) 120(5):8630–9. 10.1002/jcb.28151
19.
SharmaASteiMMFröhlichHHolzFGLoefflerKUHerwig-CarlMC. Genetic and epigenetic insights into uveal melanoma. Clin Genet (2018) 93(5):952–61. 10.1111/cge.13136
20.
RobertsonAGShihJYauCGibbEAObaJMungallKLet alIntegrative analysis identifies four molecular and clinical subsets in uveal melanoma. Cancer cell (2017) 32(2):204–20.e15. 10.1016/j.ccell.2017.07.003
21.
HerlihyNDogrusözMvan EssenTHHarbourJWvan der VeldenPAvan EggermondMCet alSkewed expression of the genes encoding epigenetic modifiers in high-risk uveal melanoma. Invest Ophthalmol Vis Sci (2015) 56(3):1447–58. 10.1167/iovs.14-15250
22.
FieldMGKuznetsovJNBussiesPLCaiLZAlawaKADecaturCLet alBAP1 loss is associated with DNA methylomic repatterning in highly aggressive Class 2 uveal melanomas. Clin Cancer Res (2019) 25:5663–73. 10.1158/1078-0432.CCR-19-0366
23.
LandrevilleSAgapovaOAMatatallKAKneassZTOnkenMDLeeRSet alHistone deacetylase inhibitors induce growth arrest and differentiation in uveal melanoma. Clin Cancer Res (2012) 18:408–16. 10.1158/1078-0432.CCR-11-0946
24.
MatatallKAAgapovaOAOnkenMDWorleyLABowcockAMHarbourJW. BAP1 deficiency causes loss of melanocytic cell identity in uveal melanoma. BMC Cancer (2013) 13:371. 10.1186/1471-2407-13-371
25.
KuznetsovJNAgueroTHOwensDAKurtenbachSFieldMGDuranteMAet alBAP1 regulates epigenetic switch from pluripotency to differentiation in developmental lineages giving rise to BAP1-mutant cancers. Sci Adv (2019) 5:eaax1738. 10.1126/sciadv.aax1738
26.
DengSCalinGACroceCMCoukosGZhangL. Mechanisms of microRNA deregulation in human cancer. Cell Cycle (2008) 7:2643–6. 10.4161/cc.7.17.6597
27.
ChenXHeDDa DongXDongFWangJWangLet alMicroRNA-124a is epigenetically regulated and acts as a tumor suppressor by controlling multiple targets in uveal melanoma. Investig Ophthalmol Vis Sci (2013) 54:2248–56. 10.1167/iovs.12-10977
28.
ChenXWangJShenHLuJLiCHuD-Net alEpigenetics, microRNAs, and carcinogenesis: Functional role of microRNA-137 in uveal melanoma. Investig Ophthalmol Vis Sci (2011) 52:1193–9. 10.1167/iovs.10-5272
29.
PlassCPfisterSMLindrothAMBogatyrovaOClausRLichterP. Mutations in regulators of the epigenome and their connections to global chromatin patterns in cancer. Nat Rev Genet (2013) 14(11):765–80. 10.1038/nrg3554
30.
Gonzalez-PerezAJene-SanzALopez-BigasN. The mutational landscape of chromatin regulatory factors across 4,623 tumor samples. Genome Biol (2013) 14(9):r106. 10.1186/gb-2013-14-9-r106
31.
MedvedevaYALennartssonAEhsaniRKulakovskiyIVVorontsovIEPanahandehPet alEpiFactors: A comprehensive database of human epigenetic factors and complexes. Database (2015) 2015:bav067. 10.1093/database/bav067
32.
MarazziIGreenbaumBDLowDHPGuccioneE. Chromatin dependencies in cancer and inflammation. Nat Rev Mol Cel Biol (2017) 19(4):245–61. 10.1038/nrm.2017.113
33.
LiTYangJYangBZhaoGLinHLiuQet alKetamine inhibits ovarian cancer cell growth by regulating the lncRNA-PVT1/EZH2/p57 Axis. Front Genet (2021) 11:597467. 10.3389/fgene.2020.597467
34.
ChuYChenWPengWLiuYXuLZuoJet alAmnion-derived mesenchymal stem cell exosomes-mediated autophagy promotes the survival of trophoblasts under hypoxia through mTOR pathway by the downregulation of EZH2. Front Cel Develop Biol (2020) 8:545852. 10.3389/fcell.2020.545852
35.
ChenJWangFXuHXuLChenDWangJet alLong non-coding RNA SNHG1 regulates the wnt/β-catenin and PI3K/AKT/mTOR signaling pathways via EZH2 to affect the proliferation, apoptosis, and autophagy of prostate cancer cell. Front Oncol (2020) 10:552907. 10.3389/fonc.2020.552907
36.
DamaschkeNAYangBBluteMLLinCPHuangWJarrardDF. Frequent disruption of chromodomain helicase DNA-binding protein 8 (CHD8) and functionally associated chromatin regulators in prostate cancer. Neoplasia (2014) 16(12):1018–27. 10.1016/j.neo.2014.10.003
37.
LuJXuJLiJPanTBaiJWangLet alFacer: Comprehensive molecular and functional characterization of epigenetic chromatin regulators. Nucleic Acids Res (2018) 46(19):10019–33. 10.1093/nar/gky679
38.
LaurentCValetFPlanqueNSilveriLMaachaSAnezoOet alHigh PTP4A3 phosphatase expression correlates with metastatic risk in uveal melanoma patients. Cancer Res (2011) 71(3):666–74. 10.1158/0008-5472.can-10-0605
39.
van EssenTHvan PeltSIBronkhorstIHGVersluisMNématiFLaurentCet alUpregulation of HLA expression in primary uveal melanoma by infiltrating leukocytes. PLOS ONE (2016) 11(10):e0164292. 10.1371/journal.pone.0164292
40.
DaiWLiYMoSFengYZhangLXuYet alA robust gene signature for the prediction of early relapse in stage I-III colon cancer. Mol Oncol (2018) 12(4):463–75. 10.1002/1878-0261.12175
41.
GaujouxRSeoigheC. A flexible R package for nonnegative matrix factorization. BMC Bioinformatics (2010) 11(1):367. 10.1186/1471-2105-11-367
42.
TangWHuJZhangHWuPHeH. Kappa coefficient: A popular measure of rater agreement. Shanghai Arch Psychiatry (2015) 27(1):62–7. 10.11919/j.issn.1002-0829.215010
43.
McHughML. Interrater reliability: The kappa statistic. Biochemia Med (2012) 22(3):276–82. 10.11613/bm.2012.031
44.
MarsegliaMAmaroASolariNGangemiRCroceETandaETet alHow to make immunotherapy an effective therapeutic choice for uveal melanoma. Cancers (2021) 13(9):2043. 10.3390/cancers13092043
45.
ZhuKLiuXDengWWangGFuB. Identification of a chromatin regulator signature and potential candidate drugs for bladder cancer. Hereditas (2022) 159(1):13. 10.1186/s41065-021-00212-x
46.
MardinianKAdashekJJBottaGPKatoSKurzrockR. SMARCA4: Implications of an altered chromatin-remodeling gene for cancer development and therapy. Mol Cancer Ther (2021) 20(12):2341–51. 10.1158/1535-7163.mct-21-0433
47.
ShuX-SLiLTaoQ. Chromatin regulators with tumor suppressor properties and their alterations in human cancers. Epigenomics (2012) 4(5):537–49. 10.2217/epi.12.50
48.
Gurard-LevinZAWilsonLOWPancaldiVPostel-VinaySSousaFGReyesCet alChromatin regulators as a guide for cancer treatment choice. Mol Cancer Ther (2016) 15(7):1768–77. 10.1158/1535-7163.mct-15-1008
49.
DebaugnyRESkokJA. CTCF and CTCFL in cancer. Curr Opin Genet Develop (2020) 61:44–52. 10.1016/j.gde.2020.02.021
50.
JiangYLiuSChenXCaoYTaoY. Genome-wide distribution of DNA methylation and DNA demethylation and related chromatin regulators in cancer. Biochim Biophys Acta (Bba) - Rev Cancer (2013) 1835(2):155–63. 10.1016/j.bbcan.2012.12.003
51.
BechtEGiraldoNALacroixLButtardBElarouciNPetitprezFet alEstimating the population abundance of tissue-infiltrating immune and stromal cell populations using gene expression. Genome Biol (2016) 17(1):218. 10.1186/s13059-016-1070-5
52.
ZhaoHChenYShenPGongL. Identification of immune cell infiltration landscape and their prognostic significance in uveal melanoma. Front Cel Dev Biol (2021) 9:713569. 10.3389/fcell.2021.713569
53.
HellstromKEHellstromI. From the Hellstrom paradox toward cancer cure. Prog Mol Biol translational Sci (2019) 164:1–24. 10.1016/bs.pmbts.2018.11.002
54.
MaQYHuangDYZhangHJChenJMillerWChenXF. Function of follicular helper T cell is impaired and correlates with survival time in non-small cell lung cancer. Int immunopharmacology (2016) 41:1–7. 10.1016/j.intimp.2016.10.014
55.
ZappasodiRBudhuSHellmannMDPostowMASenbabaogluYManneSet alNon-conventional inhibitory CD4+Foxp3-PD-1hi T cells as a biomarker of immune checkpoint blockade activity. Cancer cell (2018) 33(6):1017–32. 10.1016/j.ccell.2018.05.009
56.
NiogretJBergerHRebeCMaryRBallotETruntzerCet alFollicular helper-T cells restore CD8+-dependent antitumor immunity and anti-PD-L1/PD-1 efficacy. J Immunother Cancer (2021) 9(6):e002157. 10.1136/jitc-2020-002157
57.
BromwichEJMcArdlePACannaKMcMillanDCMcNicolAMBrownMet alThe relationship between T-lymphocyte infiltration, stage, tumour grade and survival in patients undergoing curative surgery for renal cell cancer. Br J Cancer (2003) 89(10):1906–8. 10.1038/sj.bjc.6601400
58.
KinoshitaTMuramatsuRFujitaTNagumoHSakuraiTNojiSet alPrognostic value of tumor-infiltrating lymphocytes differs depending on histological type and smoking habit in completely resected non-small-cell lung cancer. Ann Oncol : official J Eur Soc Med Oncol (2016) 27(11):2117–23. 10.1093/annonc/mdw319
59.
McArdlePACannaKMcMillanDCMcNicolAMCampbellRUnderwoodMA. The relationship between T-lymphocyte subset infiltration and survival in patients with prostate cancer. Br J Cancer (2004) 91(3):541–3. 10.1038/sj.bjc.6601943
60.
DroeserRZlobecIKilicEGüthUHebererMSpagnoliGet alDifferential pattern and prognostic significance of CD4+, FOXP3+ and IL-17+ tumor infiltrating lymphocytes in ductal and lobular breast cancers. BMC cancer (2012) 12:134. 10.1186/1471-2407-12-134
61.
LiMZhaoJYangRCaiRLiuXXieJet alCENPF as an independent prognostic and metastasis biomarker corresponding to CD4+ memory T cells in cutaneous melanoma. Cancer Sci (2022) 113(4):1220–34. 10.1111/cas.15303
62.
MantovaniAMarchesiFMalesciALaghiLAllavenaP. Tumour-associated macrophages as treatment targets in oncology. Nat Rev Clin Oncol (2017) 14(7):399–416. 10.1038/nrclinonc.2016.217
63.
CassettaLPollardJW. Targeting macrophages: Therapeutic approaches in cancer. Nat Rev Drug Discov (2018) 17(12):887–904. 10.1038/nrd.2018.169
64.
HerwigMCBergstromCWellsJRHöllerTGrossniklausHE. M2/M1 ratio of tumor associated macrophages and PPAR-gamma expression in uveal melanomas with class 1 and class 2 molecular profiles. Exp Eye Res (2013) 107:52–8. 10.1016/j.exer.2012.11.012
65.
GajewskiTFSchreiberHFuYX. Innate and adaptive immune cells in the tumor microenvironment. Nat Immunol (2013) 14(10):1014–22. 10.1038/ni.2703
66.
JoyceJAFearonDT. T cell exclusion, immune privilege, and the tumor microenvironment. Science (New York, N.Y.) (2015) 348(6230):74–80. 10.1126/science.aaa6204
67.
SprangerSGajewskiTF. Tumor-intrinsic oncogene pathways mediating immune avoidance. Oncoimmunology (2015) 5(3):e1086862. 10.1080/2162402X.2015.1086862
68.
JiangPGuSPanDFuJSahuAHuXet alSignatures of T cell dysfunction and exclusion predict cancer immunotherapy response. Nat Med (2018) 24(10):1550–8. 10.1038/s41591-018-0136-1
69.
Torrens-MasMOliverJRocaPSastre-SerraJ. SIRT3: Oncogene and tumor suppressor in cancer. Cancers (2017) 9(7):90. 10.3390/cancers9070090
70.
KennyTCCraigAJVillanuevaAGermainD. Mitohormesis primes tumor invasion and metastasis. Cel Rep (2019) 27(8):2292–303. 10.1016/j.celrep.2019.04.095
71.
KennyTCHartPRagazziMSersingheMChipukJSagarMAKet alSelected mitochondrial DNA landscapes activate the SIRT3 axis of the UPRmt to promote metastasis. Oncogene (2017) 36(31):4393–404. 10.1038/onc.2017.52
72.
LeeJJvan de VenRAHZaganjorENgMRBarakatADemmersJJPGet alInhibition of epithelial cell migration and Src/FAK signaling by SIRT3. Proc Natl Acad Sci United States America (2018) 115(27):7057–62. 10.1073/pnas.1800440115
73.
WeiZSongJWangGCuiXZhengJTangYet alDeacetylation of serine hydroxymethyl-transferase 2 by SIRT3 promotes colorectal carcinogenesis. Nat Commun (2018) 9(1):4468. 10.1038/s41467-018-06812-y
74.
LiangLLiQHuangLLiDLiX. Sirt3 binds to and deacetylates mitochondrial pyruvate carrier 1 to enhance its activity. Biochem biophysical Res Commun (2015) 468(4):807–12. 10.1016/j.bbrc.2015.11.036
75.
FuWLiHFuHZhaoSShiWSunMet alThe SIRT3 and SIRT6 promote prostate cancer progression by inhibiting necroptosis-mediated innate immune response. J Immunol Res (2020) 2020:8820355. 10.1155/2020/8820355
76.
LiRQuanYXiaW. SIRT3 inhibits prostate cancer metastasis through regulation of FOXO3A by suppressing Wnt/β-catenin pathway. Exp Cel Res (2018) 364(2):143–51. 10.1016/j.yexcr.2018.01.036
77.
LuoHMaCShaoJCaoJ. Prognostic implications of novel ten-gene signature in uveal melanoma. Front Oncol (2020) 10:567512. 10.3389/fonc.2020.567512
78.
HoLCrabtreeGR. Chromatin remodelling during development. Nature (2010) 463(7280):474–84. 10.1038/nature08911
79.
LickertHTakeuchiJKvon BothIWallsJRMcAuliffeFLee AdamsonSet alBaf60c is essential for function of BAF chromatin remodelling complexes in heart development. Nature (2004) 432(7013):107–12. 10.1038/nature03071
80.
TropéeRde la Peña AvalosBGoughMSnellCDuijfPHGDrayE. The SWI/SNF subunit SMARCD3 regulates cell cycle progression and predicts survival outcome in ER+ breast cancer. Breast Cancer Res Treat (2020) 185(3):601–14. 10.1007/s10549-020-05997-5
81.
JordanNVPratAAbellANZawistowskiJSSciakyNKarginovaOAet alSWI/SNF chromatin-remodeling factor smarcd3/baf60c controls epithelial-mesenchymal transition by inducing Wnt5a signaling. Mol Cell Biol (2013) 33(15):3011–25. 10.1128/mcb.01443-12
82.
JiangMWangHChenHHanY. SMARCD3 is a potential prognostic marker and therapeutic target in CAFs. Aging (2020) 12(20):20835–61. 10.18632/aging.104102
83.
TakitaJIshiiMTsutsumiSTanakaYKatoKToyodaYet alGene expression profiling and identification of novel prognostic marker genes in neuroblastoma. Genes, Chromosomes and Cancer (2004) 40(2):120–32. 10.1002/gcc.20021
84.
AjoreRNiroulaAPertesiMCafaroCThodbergMWentMet alFunctional dissection of inherited non-coding variation influencing multiple myeloma risk. Nat Commun (2022) 13(1):151. 10.1038/s41467-021-27666-x
85.
ZhaoD-DZhaoXLiWT. Identification of differentially expressed metastatic genes and their signatures to predict the overall survival of uveal melanoma patients by bioinformatics analysis. Int J Ophthalmol (2020) 13(7):1046–53. 10.18240/ijo.2020.07.05
86.
MatiasPMGoryniaSDonnerPCarrondoMA. Crystal structure of the human AAA+ protein RuvBL1. J Biol Chem (2006) 281(50):38918–29. 10.1074/jbc.m605625200
87.
GuoHZhangX-YPengJHuangYYangYLiuYet alRUVBL1, a novel C-RAF-binding protein, activates the RAF/MEK/ERK pathway to promote lung cancer tumorigenesis. Biochem Biophysical Res Commun (2018) 498(4):932–9. 10.1016/j.bbrc.2018.03.084
88.
FanWXieJXiaJZhangYYangMWangHet alRUVBL1-ITFG1 interaction is required for collective invasion in breast cancer. Biochim Biophys Acta (Bba) - Gen Subjects (2017) 1861(7):1788–800. 10.1016/j.bbagen.2017.03.016
89.
MelloTMaterozziMZanieriFSimeoneICeniEBereshchenkoOet alLiver haploinsufficiency of RuvBL1 causes hepatic insulin resistance and enhances hepatocellular carcinoma progression. Int J Cancer (2019) 146(12):3410–22. 10.1002/ijc.32787
Summary
Keywords
prognosis, uveal melanoma, TCGA, chromatin regulators, tumor subtypes
Citation
Li Y, Xiong C, Wu LL, Zhang BY, Wu S, Chen YF, Xu QH and Liao HF (2023) Tumor subtypes and signature model construction based on chromatin regulators for better prediction of prognosis in uveal melanoma. Pathol. Oncol. Res. 29:1610980. doi: 10.3389/pore.2023.1610980
Received
29 November 2022
Accepted
26 May 2023
Published
09 June 2023
Volume
29 - 2023
Edited by
József Tímár, Semmelweis University, Hungary
Updates
Copyright
© 2023 Li, Xiong, Wu, Zhang, Wu, Chen, Xu and Liao.
This is an open-access article distributed under the terms of the Creative Commons Attribution License (CC BY). The use, distribution or reproduction in other forums is permitted, provided the original author(s) and the copyright owner(s) are credited and that the original publication in this journal is cited, in accordance with accepted academic practice. No use, distribution or reproduction is permitted which does not comply with these terms.
*Correspondence: Hong Fei Liao, lhfzf@126.com; Yue Li, yuepang92@qq.com
Disclaimer
All claims expressed in this article are solely those of the authors and do not necessarily represent those of their affiliated organizations, or those of the publisher, the editors and the reviewers. Any product that may be evaluated in this article or claim that may be made by its manufacturer is not guaranteed or endorsed by the publisher.