Abstract
Activation of the mTOR pathway has been observed in osteosarcoma, however the inhibition of mammalian target of rapamycin (mTOR) complex 1 has had limited results in osteosarcoma treatment. Certain metabolic pathways can be altered by mTOR activation, which can affect survival. Our aim was to characterize the mTOR profile and certain metabolic alterations in pediatric osteosarcoma to determine the interactions between the mTOR pathway and metabolic pathways. We performed immunohistochemistry on 28 samples to analyze the expression of mTOR complexes such as phospho-mTOR (pmTOR), phosphorylated ribosomal S6 (pS6), and rapamycin-insensitive companion of mTOR (rictor). To characterize metabolic pathway markers, we investigated the expression of phosphofructokinase (PFK), lactate dehydrogenase-A (LDHA), β-F1-ATPase (ATPB), glucose-6-phosphate dehydrogenase (G6PDH), glutaminase (GLS), fatty acid synthetase (FASN), and carnitin-O-palmitoyltransferase-1 (CPT1A). In total, 61% of the cases showed low mTOR activity, but higher pmTOR expression was associated with poor histological response to chemotherapy and osteoblastic subtype. Rictor expression was higher in metastatic disease and older age at the time of diagnosis. Our findings suggest the importance of the Warburg-effect, pentose-phosphate pathway, glutamine demand, and fatty-acid beta oxidation in osteosarcoma cells. mTOR activation is linked to several metabolic pathways. We suggest performing a detailed investigation of the mTOR profile before considering mTORC1 inhibitor therapy. Our findings highlight that targeting certain metabolic pathways could be an alternative therapeutic approach.
Introduction
Osteosarcoma is the most common pediatric bone tumor, accounting for approximately 3% of all malignancies in children (1). Multi-agent chemotherapy and surgical resection of the tumor and the metastases are the cornerstones of the current treatment guidelines. With this multidisciplinary approach, up to 70% of the patients with localized disease can be long term survivors. The prognosis is poorer for patients with primary metastatic, nonresectable, or relapsed disease, and the overall survival in these cases was reported to be around 30%. Metastases at the time of the diagnosis, axial location, and chondroblastic histological subtype can indicate worse prognosis. Despite the advances in chemotherapy and surgical methods, the overall survival rates have not improved in the past few years (2). In order to develop new targeted therapies, better understanding of the molecular mechanisms of osteosarcoma is needed.
Research of cancer metabolism is an area that has gained attention in recent decades. In order to maintain the high proliferation rate, malignant cells need to rewire their metabolic pathways to gain more energy for growth and invasion. These changes consist of upregulated glycolysis (even in the presence of oxygen) also known as the “Warburg-effect,” increased glutaminolysis and lactate synthesis, alterations in lipid metabolism, and tricarboxylic acid cycle/oxidative phosphorylation. As a result of these alterations, several alternative metabolic pathways can be activated in tumor cells (3).
The role of phosphoinositide-3-kinase (PI3K)/protein-kinase B (AKT)/mammalian target of rapamycin (mTOR) pathway in tumorigenesis has been investigated thoroughly in the past years. The serin/threonine kinase mTOR is a master regulator of cell growth and proliferation, it promotes anabolic processes (protein, nucleotide, fatty acid synthesis) and inhibits catabolism. mTOR kinase is found in two different complexes, mTOR complex 1 (mTORC1) and mTOR complex 2 (mTORC2). Each complex contains different proteins as they have distinctive roles and they also differ in inhibitor sensitivity. mTORC1 contains mTOR, regulatory‐associated protein of mTOR (raptor), and G protein β subunit‐like (Gβ L, also known as mLST8), and is sensitive to rapamycin, whereas mTORC2 consists of mTOR, Gβ L, and rapamycin-insensitive companion of mammalian target of rapamycin (rictor), and could be insensitive or less sensitive to rapamycin. The activation of mTORC1 leads to increased protein synthesis, cell growth and proliferation, whereas mTORC2 regulates cytoskeleton reorganization and cell survival (4, 5). Due to mutations of the regulatory proteins/enzymes of the cellular signaling network, constitutive activation of this pathway was described in a variety of tumors. Rapamycin analogues (rapalogs) have been investigated as therapeutic agents in several human malignancies, and successfully used in certain diseases such as renal cell carcinoma and mantle cell lymphoma (6).
The mTOR pathway is critical in tumor survival and progression, and it is potentially activated in osteosarcoma, as it has been already reported, although the mechanisms of this activation are poorly understood. Some upstream (PI3K) and downstream (S6K1, 4EBP1, and eIF4E) effectors of the pathway are overexpressed in osteosarcoma, leading to alterations of cellular transformation and poorer clinical prognosis (7, 8). Inhibition of mTORC1/2 or knockdown of mTOR or rictor prevents proliferation in osteosarcoma cell lines, and the combination of mTOR kinase inhibitor PP242 with cisplatin leads to synergistic antitumor activity (9). Combination with cisplatin or bevacizumab can enhance the effectivity of temsirolimus in osteosarcoma xenografts (10), and rapamycin with spautin-1 (specific and potent autophagy inhibitor-1) was found to be effective in apoptosis induction, and can be a possible treatment option (11). Despite encouraging preclinical data, mTOR inhibitor monotherapies and combined therapies have shown poor antitumor effect in the treatment of osteosarcoma (12, 13).
Better understanding of the different tumor types’ metabolic adaptation changes is crucial in order to improve personalized therapies. Our aim was to characterize the mTOR profile and certain metabolic alterations in pediatric osteosarcoma to determine the interactions between the mTOR pathway and metabolic pathways.
Materials and Methods
Materials
We collected tissue samples of 28 patients diagnosed with osteosarcoma between 2009 and 2016 in the First Department of Pathology and Experimental Cancer Research, Semmelweis University (Budapest, Hungary). The tumors were obtained by open biopsies at the Semmelweis University Department of Orthopedics, the patients were treated in Semmelweis University’s Second Department of Pediatrics. The study was approved by the Ethics and Scientific Committee of Semmelweis University (project identification code: 99/2018).
All of the samples were taken from the primary tumor, no metastatic or relapse lesions were investigated. Clinicopathological data, such as age, sex, and histological subtype were collected from medical records (Table 1).
TABLE 1
| Histology subtype | Patients (N = 28) |
|---|---|
| Osteoblastic | 22 |
| Other | 6 |
| Chondroblastic: 3 | |
| Fibroblastic: 2 | |
| MFH-like: 1 | |
| Gender | No. |
| Male | 18 |
| Female | 10 |
| Age at diagnosis | Years |
| Median (range) | 12.9 (2.8–17.9) |
| Metastasis at the time of diagnosis | No. |
| No metastasis | 14 |
| Pulmonary metastasis | 14 |
| Chemotherapeutic response | No. |
| Good | 22 |
| Poor | 5 |
| Overall survival at 5 years | 64.20% |
Clinicopathological characteristics of the studied patients.
We have no information of one patient’s chemotherapy response as no postoperative sample was available.
Tissue microarrays (TMAs) (6 × 9; diameter, 2 mm) with double cores per patient were prepared from the formalin-fixed, paraffin-embedded tissue samples (TMA Master; 3DHistech, Budapest, Hungary). Representative areas of formalin-fixed paraffin-embedded blocks were selected based on hematoxylin-eosin stainings by an experienced pathologist. Testis, liver, and tonsil samples were used as controls.
Patient Selection, Treatment and Clinical Data
Cases were selected from osteosarcoma patients who were treated in the Semmelweis University’s Second Department of Pediatrics between 2009 and 2016. All patients from this period with available biopsy samples were included in this study.
Therapy included complete surgical removal of all detectable tumors as well as multiagent neoadjuvant and adjuvant chemotherapy. The chemotherapy regimen included several or all of the following drugs: doxorubicin, high-dose methotrexate with leukovorin-rescue, cisplatin, and ifosfamide. Resection was either limb-sparing surgery or amputation. Chemotherapeutic response was evaluated after the surgery by determining the level of necrosis of the resected tumor. If ≥ 90% of the tumor showed necrosis, it was determined as “good response,” less than 90% necrosis of the tumor was considered as “poor response” (14).
Pulmonary metastases were also surgically removed. Patients were treated in an identical manner, irrespective of histological subtype. Radiotherapy was given as a palliative treatment in one case, otherwise it was not part of the first-line therapy. After the treatment, patients had regular follow-ups. Each visit includes a history and physical examination, chest CT and bone scintigraphy is performed regularly in order to detect local recurrence or metastases. Follow up period was 5 years in this study.
Immunohistochemistry
The immunohistochemistry was performed on 4 μm thick sections of the TMA, and it was previously validated in our laboratory. After the deparaffinization and endogenous peroxidase blocking, we performed antigen retrieval for 20–30 min (citrate buffer pH 6). Slides were incubated in primary and secondary antibodies, followed by DAB (Dako, Carpinteria, CA, United States) chromogen and hematoxylin counterstaining. The primary antibodies are summarized in Table 2.
TABLE 2
| Antibody | Antigen | Clone | Dilution | Secondary antibody | Phosphorylation site | Significance | Supplier |
|---|---|---|---|---|---|---|---|
| mTOR markers | pmTOR | #2976 | 1:100 | Novolink | Ser2448 | mTORC1, mTORC2 | Cell Signaling (Boston, MA, United States) |
| pS6 | #2211 | 1:100 | Novolink | Ser235/236 | mTORC1 | Cell Signaling (Boston, MA, United States) | |
| rictor | A500-002A | 1:1000 | Vectastain | mTORC2 | Bethyl Laboratories, Inc. (Montgomery, TX, United States) | ||
| Metabolic markers | PFK | #8164 | 1:100 | Novolink | Glycolysis | Cell Signaling (Boston, MA, United States) | |
| LDHA | #3582 | 1:400 | Novolink | Glycolysis | Cell Signaling (Boston, MA, United States) | ||
| ATPB | ab14730 | 1:100 | Novolink | Oxydative phosphorylation | Abcam, Cambridge, United Kingdom | ||
| G6PDH | ab133525 | 1:100 | Novolink | Pentose phosphate pathway | Abcam, Cambridge, United Kingdom | ||
| GLS | ab156876 | 1:200 | Novolink | Glutaminolysis | Abcam, Cambridge, United Kingdom | ||
| CPT1A | ab128568 | 1:500 | Novolink | Beta oxydation of fatty acids | Abcam, Cambridge, United Kingdom | ||
| FASN | #3180 | 1:50 | Novolink | Long chain fatty acid synthesis | Cell Signaling (Boston, MA, United States) |
Antibodies and their conditions used in this investigation.
To characterize mTOR complex activity in situ, we used anti-pmTOR, anti-phosphorylated ribosomal S6 (pS6), and anti-rictor antibodies. Rictor and pmTOR results together were interpreted to confirm mTORC2 activity, mTORC1 activity was evaluated by the expression of pS6 and pmTOR.
To examine the metabolic activity features, we applied anti-LDHA (lactate-dehydrogenase A), anti- PFK (phosphofructokinase), anti- G6PDH (glucose-6-phosphate dehydrogenase), anti-ATPB (βF1-ATPase), anti-GLS (glutaminase), anti-CTP1A (carnitine O- palmitoyltransferase 1), and anti-FASN (fatty acid synthase) antibodies (Table 2).
To assess the immunohistochemistry stainings, we calculated the histoscore (H-score). With this semiquantitative analysis we scored the staining in a scale from 0 to 300. The H-score was calculated by multiplying the staining intensity (0,1+,2+,3+) by the percentage of positive cells—as previously described in other studies (15, 16). Samples with an H-score of 100 or higher were considered “high”, scores less than 100 were considered “low”. H-scores were evaluated by two independent investigators. We performed statistical data analysis according to histological subtype, age at diagnosis, metastasis at diagnosis and survival.
Statistical Analysis
Statistical analysis was performed using IBM SPSS Statistics Program version 27.0.1. (SPSS Inc., Chicago, IL, United States). We used two-sample t-test, one-way Anova test, Mann Whitney U-test, Fisher’s exact test, and Spearman’s rank correlation. A p value less than 0.05 was considered statistically significant. We compared our results according to metastases, age at diagnosis, histological subtype, response to chemotherapy, relapse, and survival.
Results
Expression of mTOR-Related Proteins
To characterize mTOR activity, we chose to use pmTOR antibody, which detects the active form of mTOR kinase. In order to analyze mTORC1 and mTORC2 activity, we used two more immunostainings, pS6, and rictor. The amount of pS6 correlates with mTORC1 activity, and rictor is a reliable marker for the quantity of mTORC2. Evaluation of the pmTOR, pS6, and rictor activity together can give us a result regarding the specimen’s mTOR activity. Co-expression of pmTOR and pS6 was considered as the activation of the mTORC1 complex. Assessment of mTORC2 activity was based on the co-expression of pmTOR and rictor. Rictor immunopositivity without pmTOR or pS6 positivity was considered as the potential activation of the mTORC2 complex. The positivity of pmTOR without pS6 or rictor was determined as potential mTOR activity.
In the evaluated osteosarcoma samples, we observed low pS6, rictor, and pmTOR activity. Most of the cases (61%) showed low mTOR activity, although 21% of the samples showed potential mTORC2 and 14% showed potential mTOR activity. We found mTORC2 activity in only one sample (4%). Figures 1, 2.
FIGURE 1
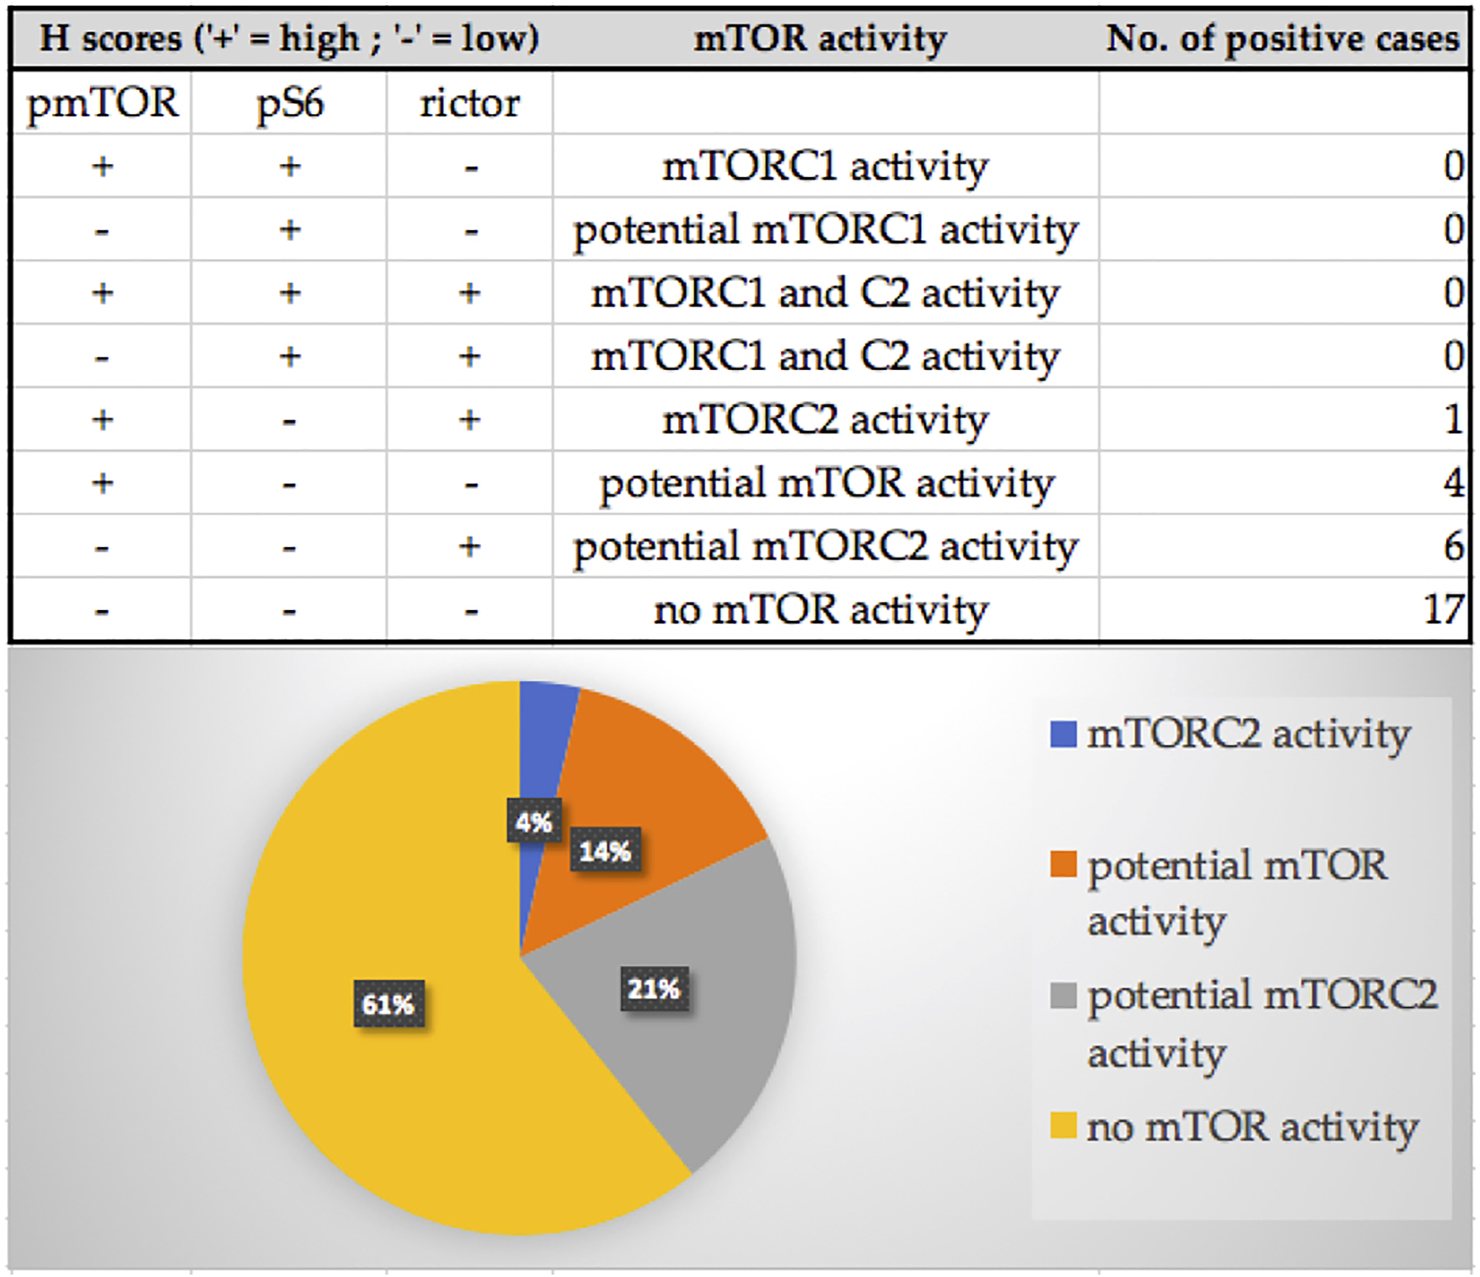
The distribution of the pmTOR, pS6 and rictor immunostaining results and mTOR activity characterization of the samples. Most of the cases (61%) showed low mTOR activity, although 21% of the samples showed potential mTORC2 and 14% showed potential mTOR activity. We found mTORC2 activity in only one sample (4%).
FIGURE 2
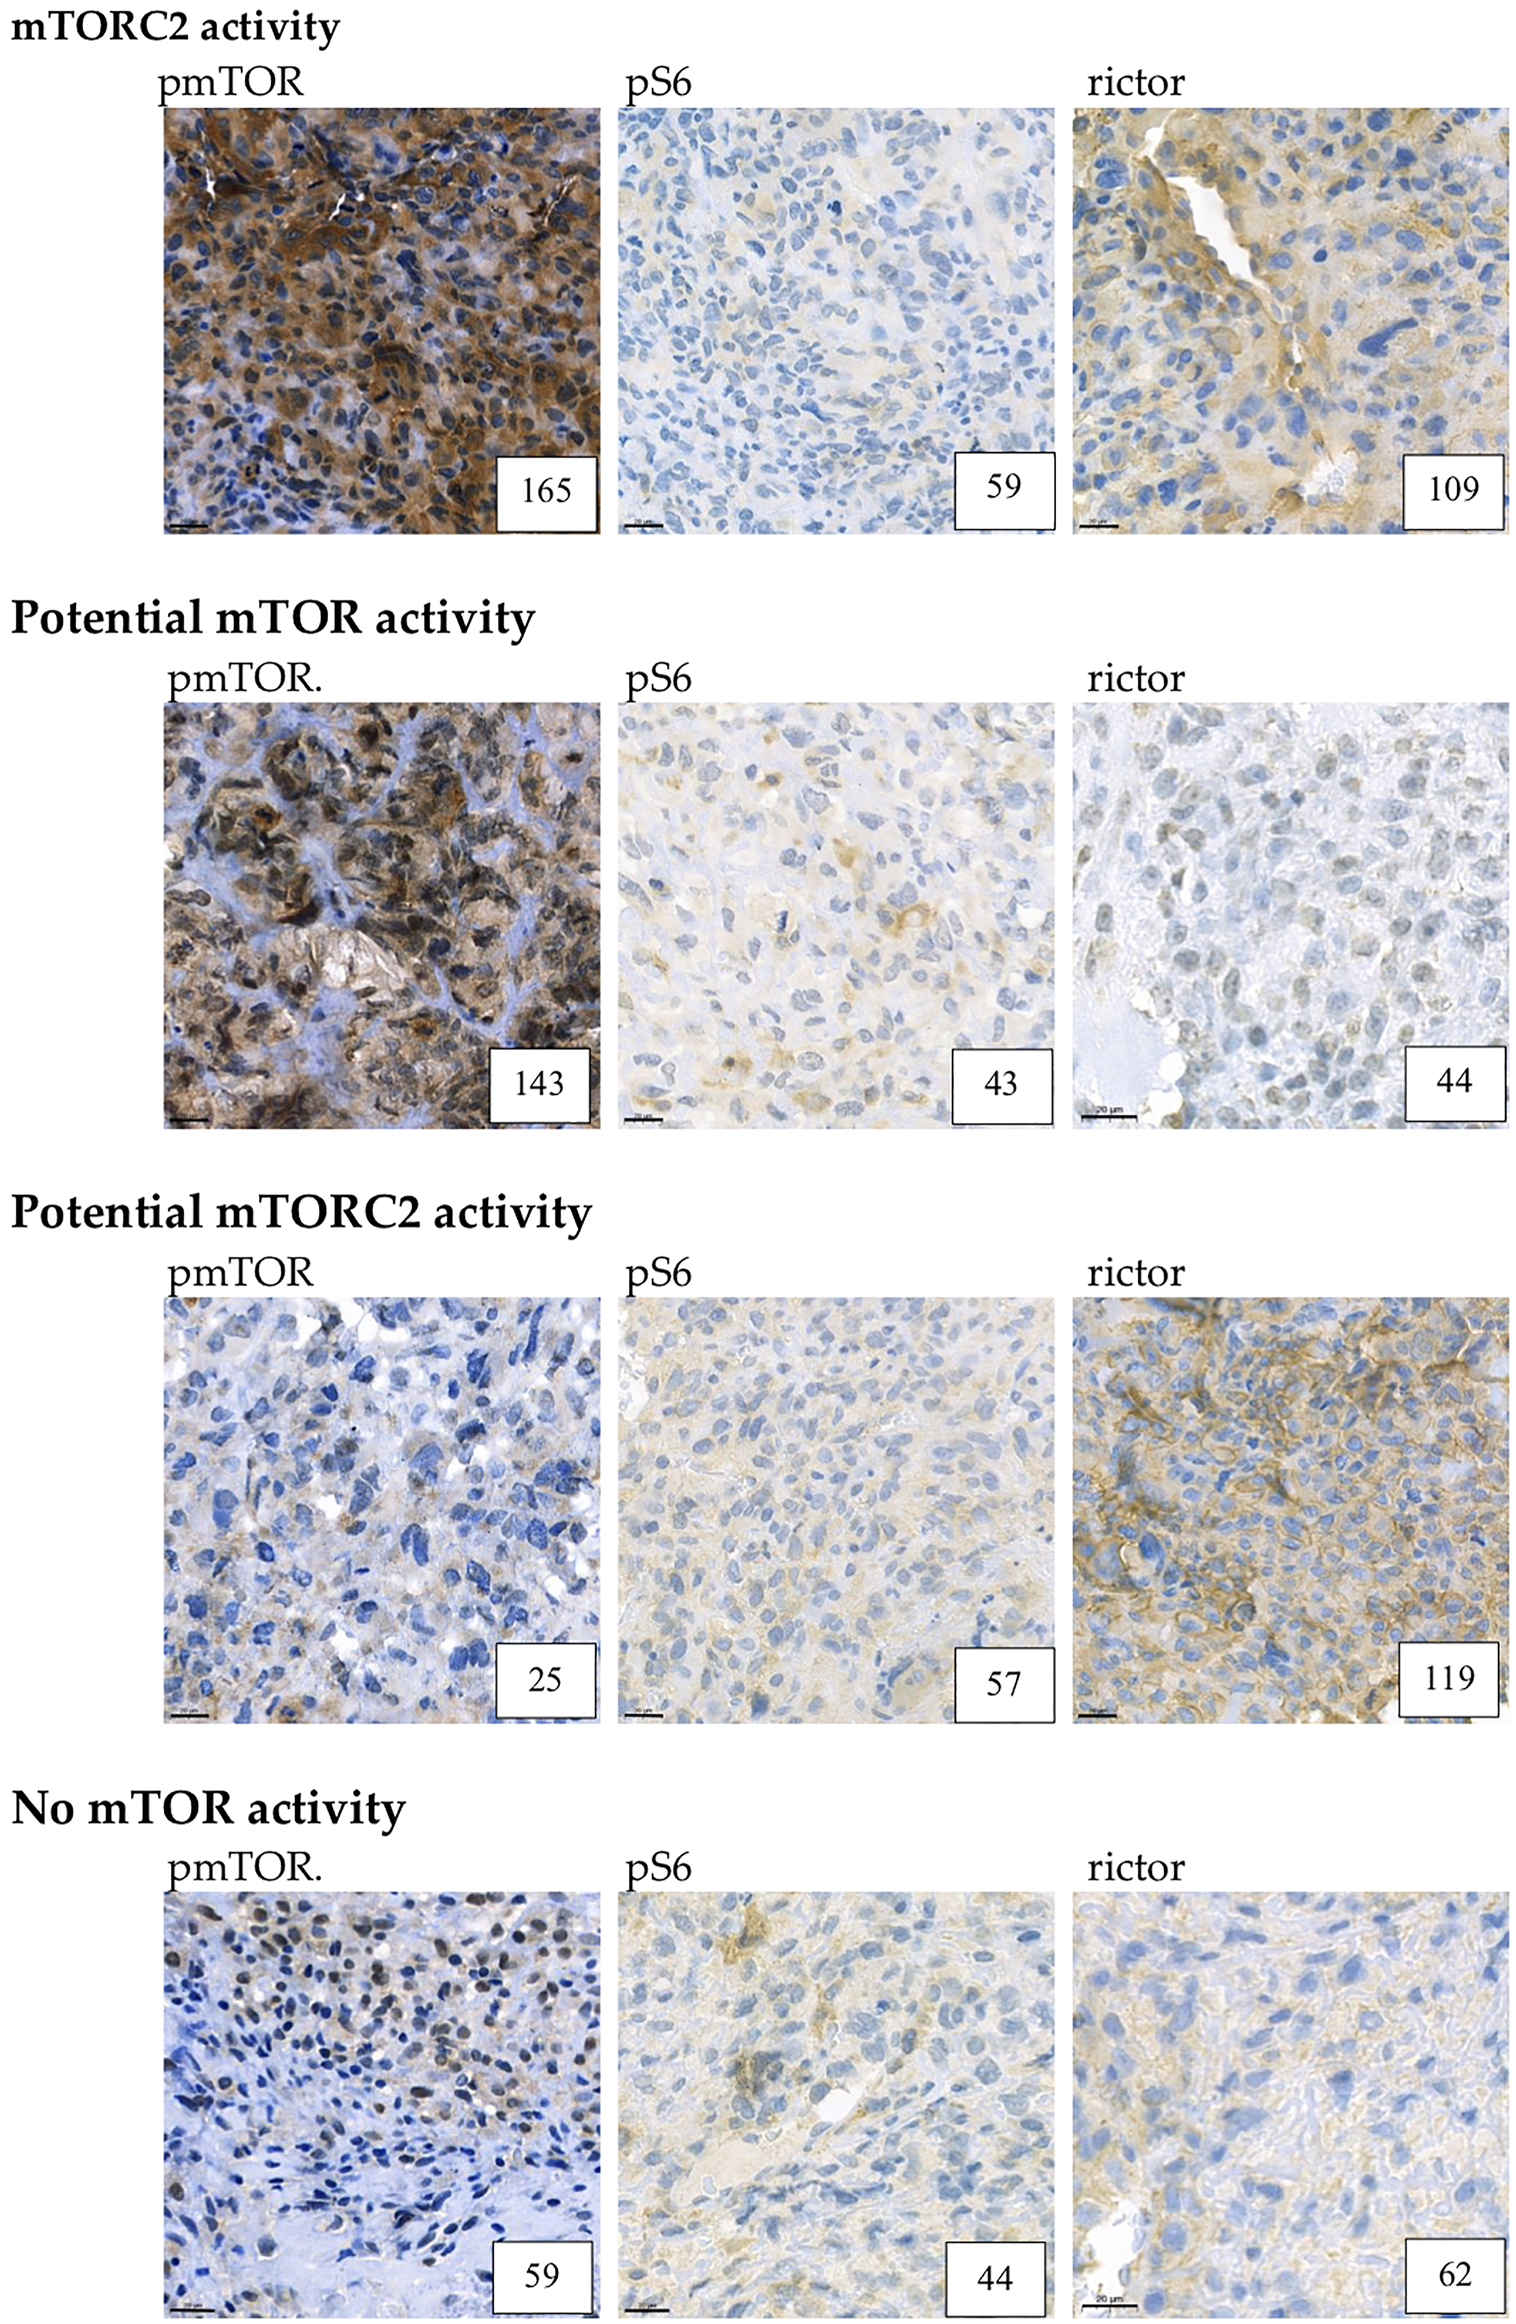
Example for mTORC2, potential mTOR, potential mTORC2 and low mTOR activity. Representative pmTOR, pS6 and rictor immunohistochemical stainings are presented. The numbers in the right lower corner are the given H-scores for each sample. Pictures were taken with CaseViewer 2.3. Software (3D Histech Ltd. Budapest, Hungary). The scale bar shows 20 μm.
Expression of Metabolic Pathway-Related Proteins
Glycolysis, Oxidative Phosphorylation, and Footprints of Warburg-effect in Osteosarcoma Cells
Cytoplasmic immunoreactivity of PFK was low in most of the samples, only 32% of the cases showed high H-scores, the median of the H-score values was 77. In contrast, the expression of LDHA—the marker of anaerobic glycolysis (Warburg-effect)—was high in 93% of the cases. We observed low ATPB expression (only 39.3% of the cases were evaluated as high), which suggests that oxidative phosphorylation is less pronounced in the examined samples. These data underline the importance of Warburg-effect in osteosarcoma cells (Figure 3).
FIGURE 3
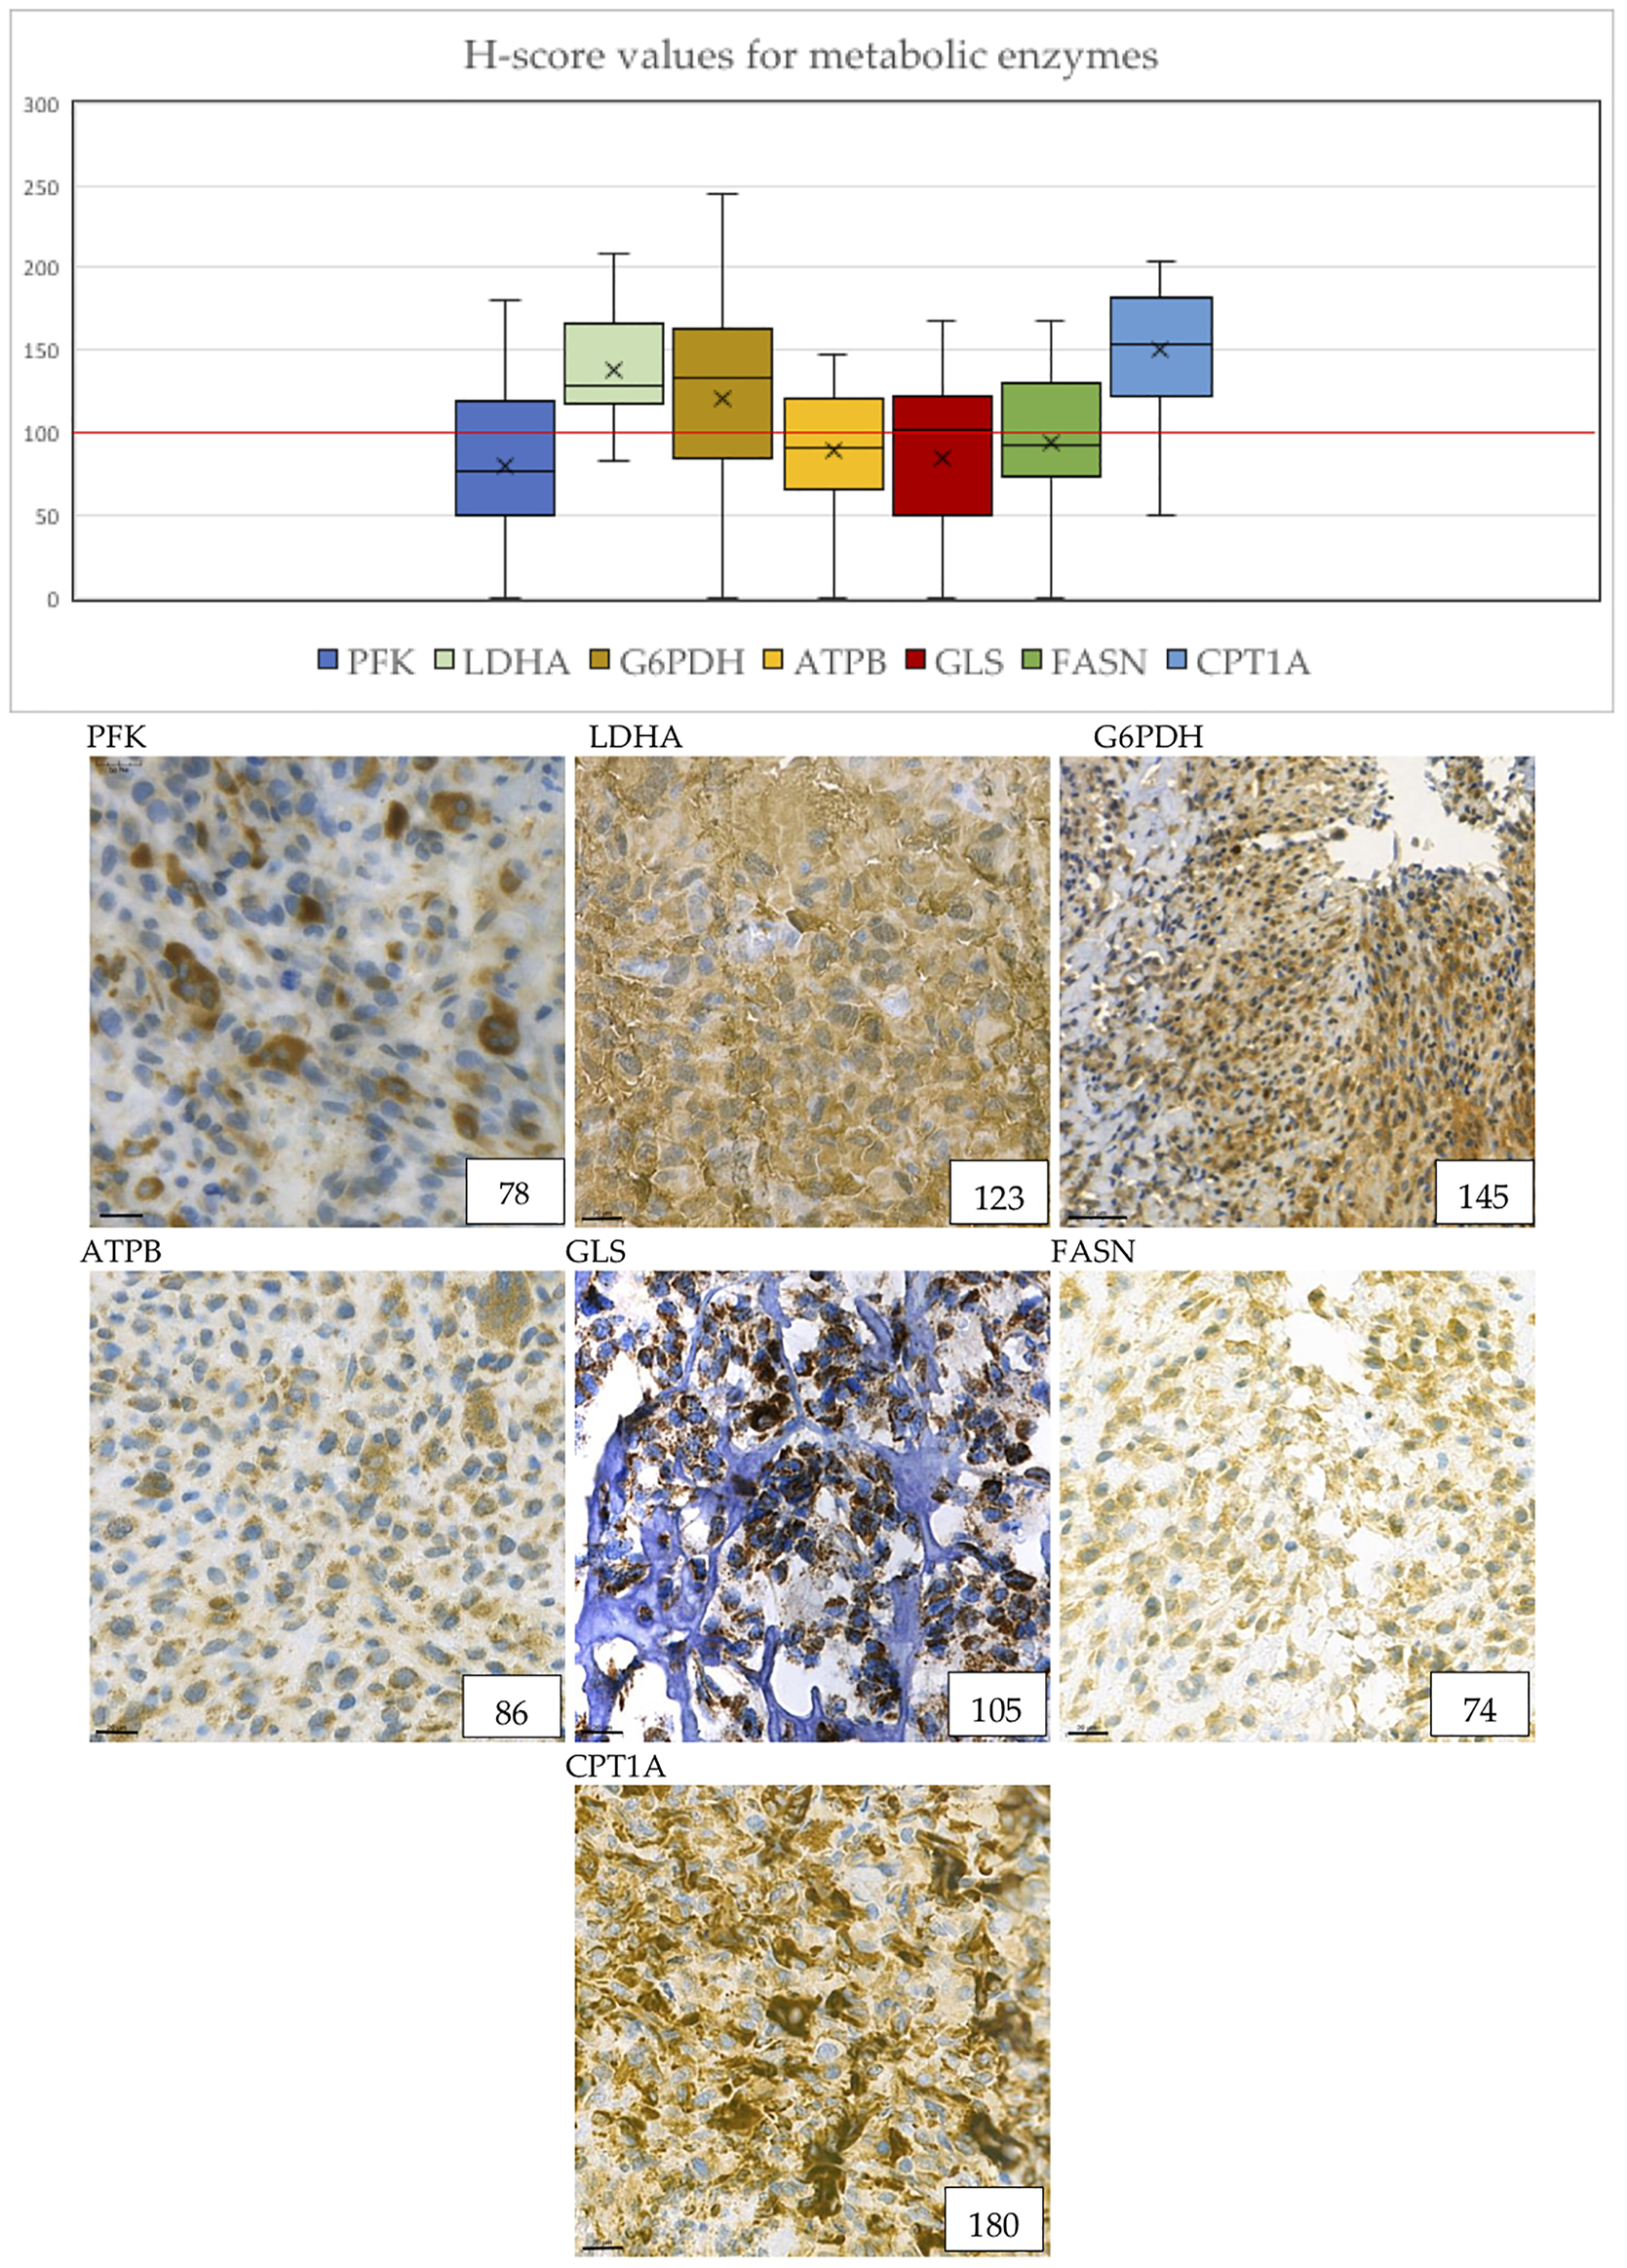
Metabolic marker expression in osteosarcoma cases. The distribution of H-scores are visible on the boxplot graph. “X” signs the mean, horizontal lines sign the median values of H-scores. The numbers in the right lower corner are the given H-scores for each sample. Evaluation of metabolic markers showed that LDHA, G6PDH, GLS and CPT1A expression was high in most of the cases. ATPB and GLS shows granular pattern due to mitochondrial localization. Pictures were taken with CaseViewer 2.3. Software (3D Histech Ltd. Budapest, Hungary). The scale bar shows 20 μm.
Importance of the Pentose Phosphate Pathway
We evaluated the expression of G6PDH as a marker of the pentose phosphate pathway. 71.4% of the cases showed high expression of G6PDH, which suggests that this pathway may have a crucial role in the metabolism of osteosarcoma cells. In addition, the H-score values of G6PDH turned out to be the second highest of all stainings with the median value of 133.5 (Figure 3).
Glutaminolysis
Glutaminase (marker of glutaminolysis) was highly expressed in 53.6% of the cases, with a median H-score of 102, suggesting that glutamine may be used as an alternative bioenergetic substrate in osteosarcoma tumorigenesis (Figure 3).
Fatty Acid Beta Oxidation and Long Chain Fatty Acid Synthesis
CPT1A is a rate-limiting enzyme in fatty acid beta oxidation. The expression of this enzyme was positive in 89.3% of the cases, and the median of the H-scores showed the highest results of all immunostainings. This data underlines the importance of fatty acid beta oxidation in osteosarcoma cells.
FASN is an enzyme involved in endogenous lipogenesis, its function is to catalyze the synthesis of long-chain fatty acids. We found that FASN was highly expressed in 42.9% of the cases (Figure 3).
Association Between Protein Expression and Clinicopathologic Parameters
Based on the expression of pmTOR, mTOR activity was found to be low in most of the cases. However, we found that pmTOR expression was significantly lower in patients with good histological response to chemotherapy (Fisher’s exact test, p = 0.031). Expression of pmTOR was also significantly lower in non-osteoblastic histology subtype (Mann-Whitney-U test, p = 0.029) (Figure 4A). Regarding rictor expression, our results showed that H-scores for rictor were significantly higher in metastatic disease (two-sample t-test, p = 0.019), and lower in those patients, who were diagnosed before the age of 14 (Fisher’s exact test, p = 0.038) (Figure 4B).
FIGURE 4
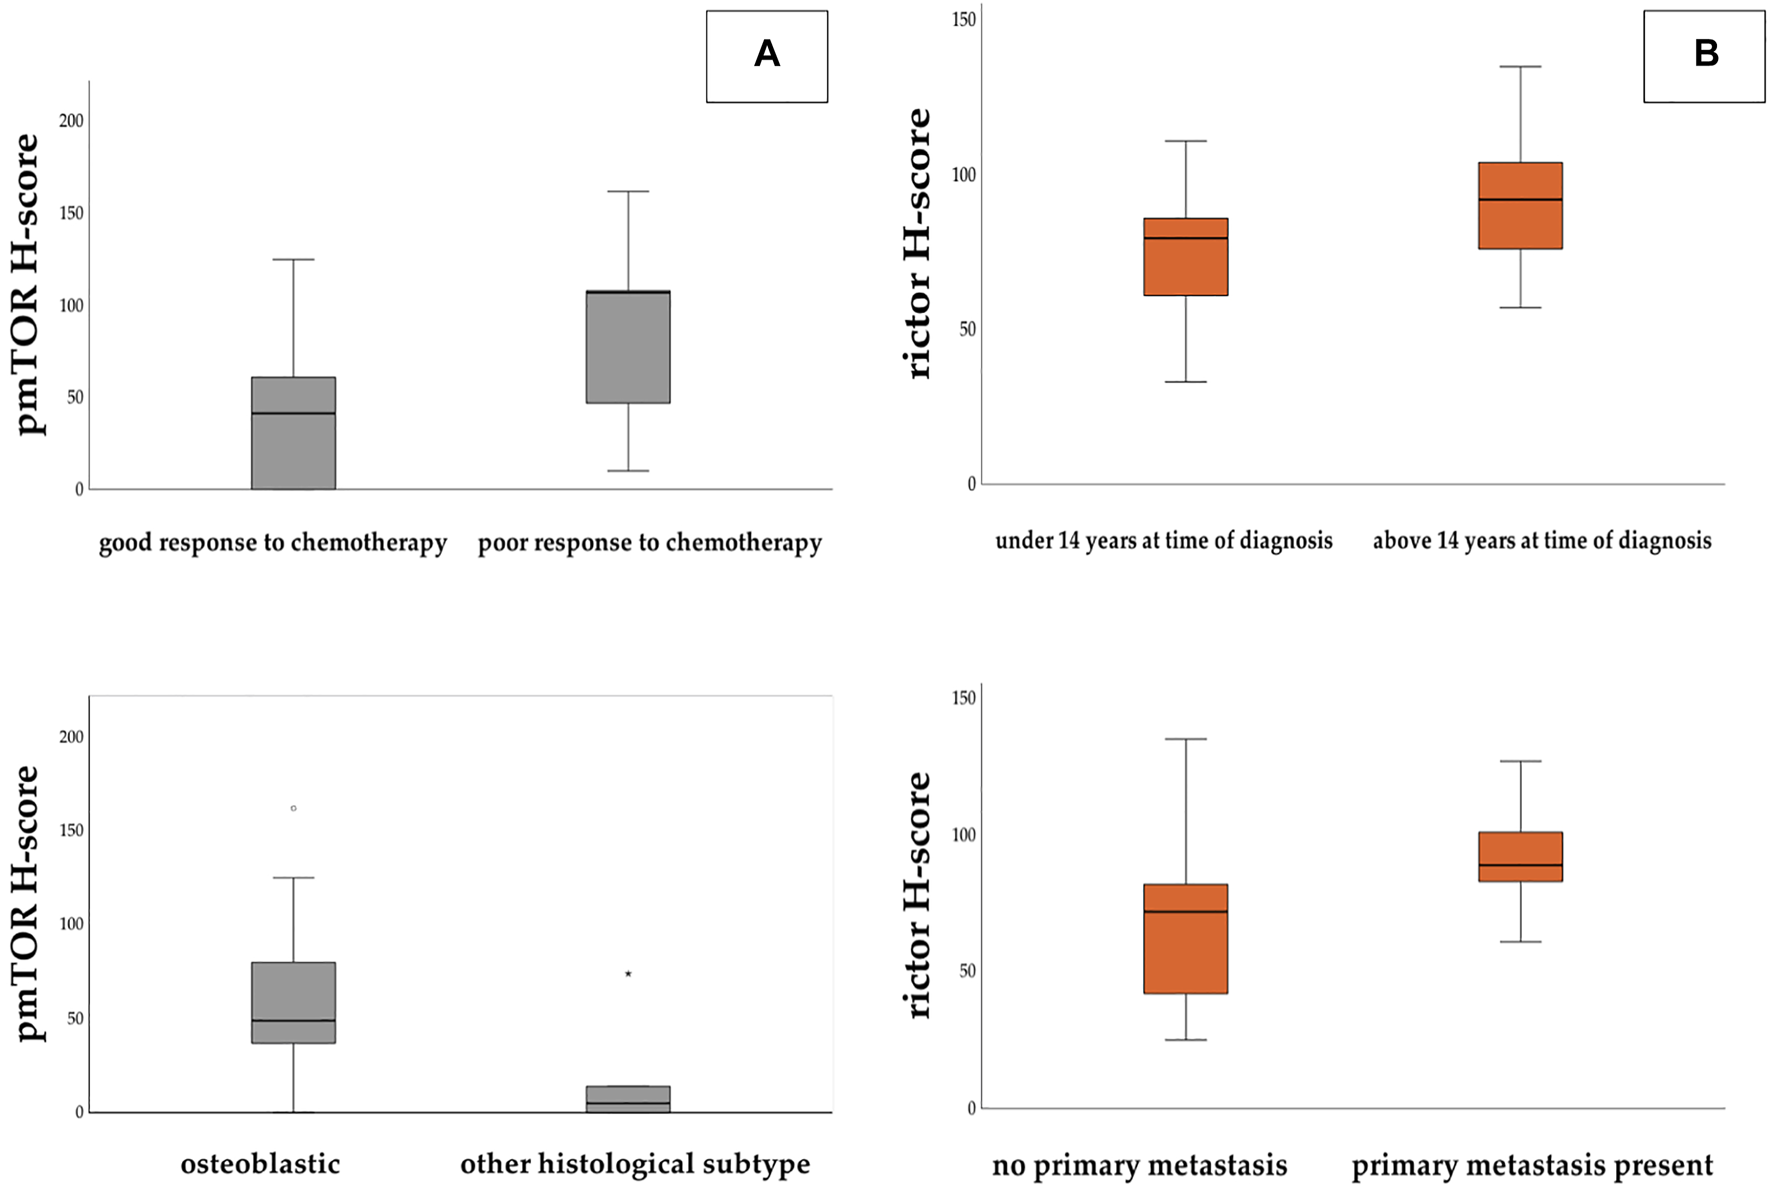
Panel (A): H-score values for pmTOR were found significantly higher in those patients who showed poor response to chemotherapy. H-score levels were significantly lower in non-osteoblastic subtype. Panel (B): H-score values for rictor were significantly higher in those patients who had metastasis at the time of the diagnosis and who were older than 14 years.
We found statistically significant elevation of GLS expression in those patients, who died due to progression or relapse (Fisher’s exact test, p = 0.043 and Mann-Whitney-U test, p = 0.02) (Figure 5A).
FIGURE 5
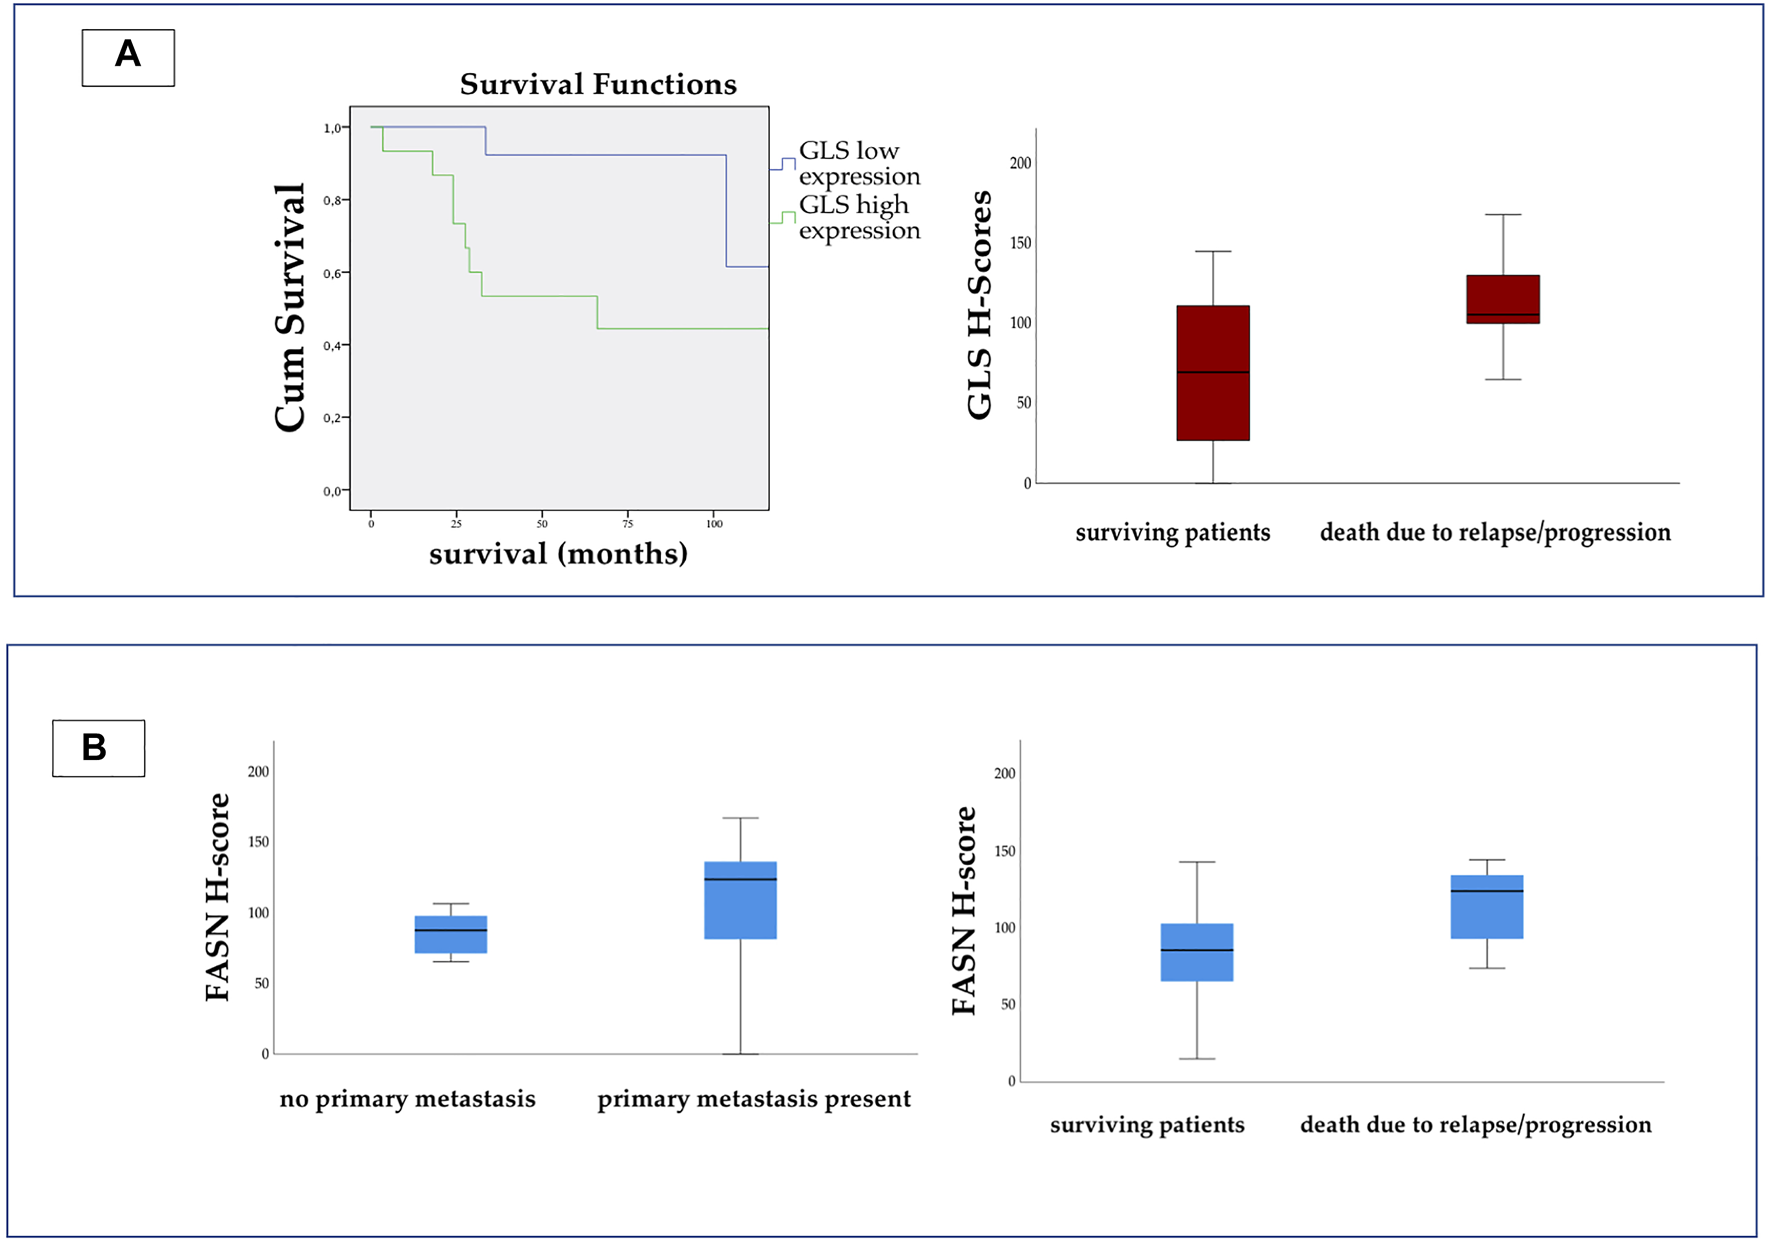
On the left side of Panel (A) Kaplan-Meier curve shows significant difference between the survival of patients with high and low GLS expression. (Log Rank p = 0.019.) On the right side we present the H-score values for GLS. The scores were significantly higher in patients, who died due to relapse or progression. On Panel (B) we present the H-score values for FASN. The expression was significantly higher in metastatic disease, and in patients who died due to relapse or progression.
The H-score for FASN appeared to be significantly higher in patients with metastatic disease (Fisher’s exact test, p = 0.027) and also in those who died due to progression or relapse (Fisher’s exact test, p = 0.039 and Mann-Whitney-U test, p = 0.036) (Figure 5B).
Correlation Between mTOR and Metabolic Pathway-Related Proteins
Data analyses with Spearman correlation test showed multiple associations between mTOR activity and enzyme expression in this study. We found positive correlations between pmTOR and PFK (R = 0.489 p = 0.008), pmTOR and ATPB (R = 0.439 p = 0.02), and also between pmTOR and GLS expression (R = 0.647 p < 0.001). Rictor and CPT1A showed positive correlation as well. (R = 0.431 p = 0.02) (Figure 6).
FIGURE 6
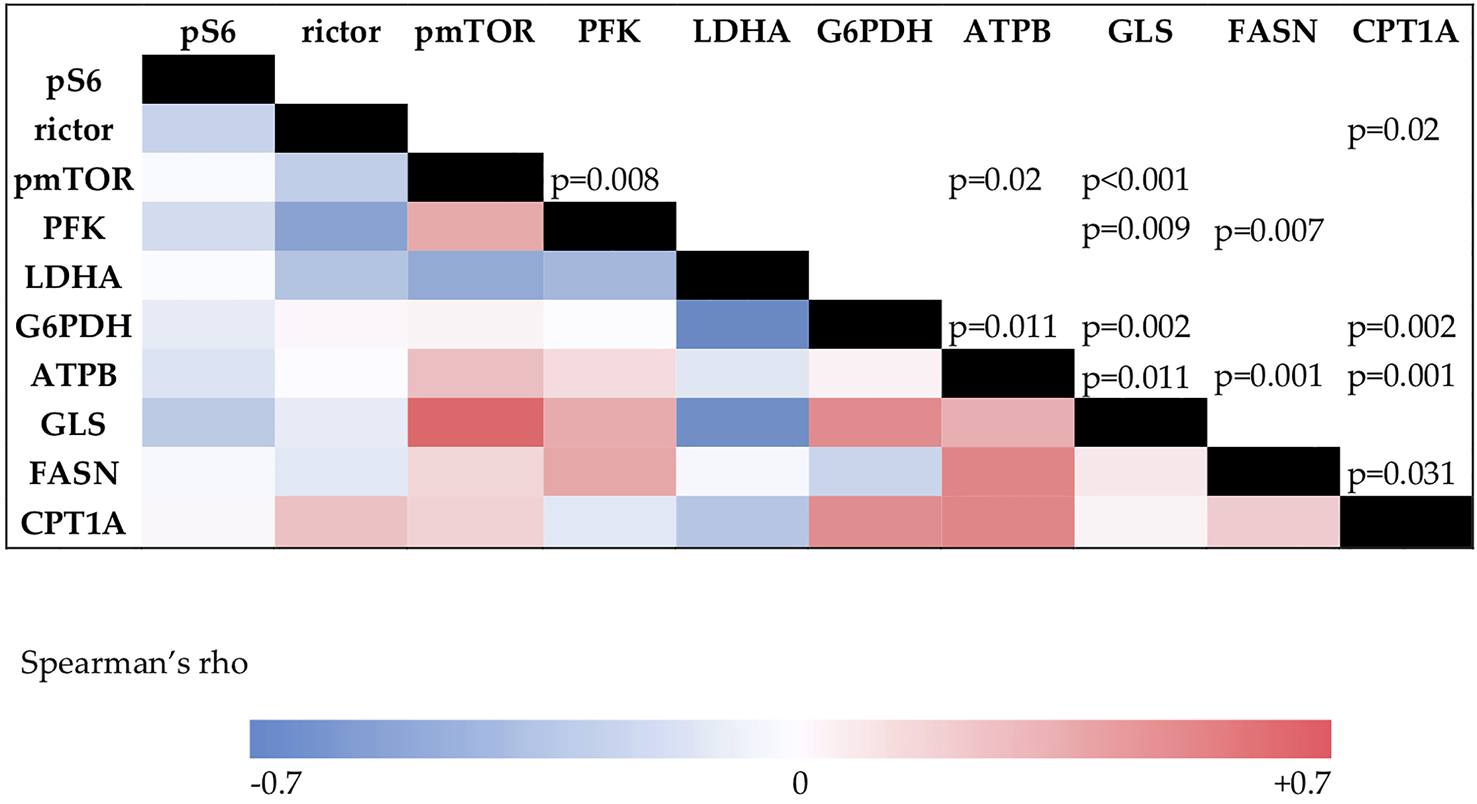
The results of the Spearman’s correlation analysis. The color intensity changes according to the Spearman’s rho value. Correlation coefficient above 0.4 is considered positive, under −0.4 is considered negative correlation. p values for significance are visible in the upper triangle.
Discussion
Osteosarcoma is an aggressive bone sarcoma, affecting mainly children and adolescents. In the 1960s the treatment of this disease was surgery alone, resulting in poor survival rates of 11%. The initiation of adjuvant chemotherapy in the 1970s increased 5-year survival rates up to 70%, but no significant improvements have been made since (2, 17). The survival of relapsed patients, or cases with primary progression remains poor. In order to improve outcome, it is crucial to investigate molecular mechanisms behind osteosarcoma tumorigenesis and progression. Our aim was to characterize the mTOR and metabolic profile of osteosarcoma cases, and to determine potential targets for personalized therapies.
Numerous preclinical data suggest the importance of mTOR activity in osteosarcoma cell proliferation and survival. Investigations with NVP-BEZ235, a PI3K-mTOR dual inhibitor suppressed osteosarcoma cell growth in vitro and in vivo (18). Similar results were found with the novel mTORC1/C2 dual inhibitor RES-529, which potently inhibits human osteosarcoma cell growth (19). mTOR inhibitors alone, or in combination have been also explored in phase I and II trials (20). Everolimus, mTORC1 inhibitor, combined with sorafenib induced partial response in 5%, and disease control in 63% of the studied 38 osteosarcoma patients (21). Sirolimus, mTORC1 inhibitor, was combined with gemcitabine in a recent phase II trial, resulting in low response rate (6%), but 42% of the patients had stable disease at 4 months of treatment (22). As the data suggest, inhibition of the mTOR pathway has been expected as a promising therapeutic approach, but mTOR inhibitors have not proved their efficacy in osteosarcoma treatment, only in combination with different cytotoxic agents.
It is proved that the mTOR pathway has a potential role in facilitating metastasis. In a murine model of osteosarcoma, rapamycin reduced tumor cell metastasis by blocking the mTORC1 pathway (23). Even though our results suggested low mTOR activity in most of the samples, we found significantly higher H-scores of rictor in primary metastatic diseases. Similar results were found in metastatic lung adenocarcinoma (24). Consistent with these findings, pmTOR activity turned out to be higher in poor responders. In addition, the only patient with mTORC2 activity had a primary progressive disease, showed no clinical response to chemotherapy, and passed away due to disease progression. We observed low expression of rictor in young patients. Younger age at time of diagnosis is associated with better survival (25, 26). We also found significant difference in pmTOR activity between the osteoblastic subtype and other histological subtype group, but due to the low number of non-osteoblastic cases, this data cannot be considered representative. Our results suggest the importance of the mTOR pathway in disease progression and metastasis progression.
Considering our results, we suggest to perform in situ mTOR activity profiling before administering mTOR inhibitor therapy for osteosarcoma patients. The most widespread mTOR pathway inhibitors are the mTORC1 inhibitors of the rapalog family. Our results suggest low mTORC1 activity in osteosarcoma, which could stand behind the failure of rapalog therapy in this malignancy.
The mTOR pathway plays a key role in the altered metabolic processes of malignant cells (27, 28). The metabolic profiles of osteosarcoma cells were investigated by characterizing enzymes that play a role in glycolysis (PFK and LDHA), oxidative phosphorylation (ATPB), pentose-phosphate pathway (G6PDH), glutaminolysis (GLS), fatty acid beta oxidation (FASN) and long chain fatty acid synthesis (CPT1A). Malignant cells generate huge amounts of energy for their survival by anaerobic glycolysis (29). By suppressing this process in osteosarcoma cells in vivo with the combination of glycolysis inhibitor 2-deoxyglucose (2DG) and adriamycin, a potent antitumor effect was observed (30). We also detected elevated LDHA levels in most of our samples, and moderate expression of ATPB. These findings suggest the hyperactivity of Warburg effect -related enzymes and the lower importance of oxidative phosphorylation in osteosarcoma tissue in vivo. Targeting the glycolytic process has been demonstrated to be effective for controlling growth and enhancing anticancer therapies (31, 32).
Enhanced pentose-phosphate pathway activity of numerous malignancies has also been reported (33, 34). In a recent study, osteosarcoma cell growth inhibition was observed by suppressing the level of G6PDH (35). Elevated G6PDH levels in our samples underline the importance of the pentose-phosphate pathway in the nucleotide biosynthesis of osteosarcoma cells.
The importance of glutaminolysis has also been widely investigated in malignant diseases (36). In metastatic cases, cells rely on glutamine as a nutrient for proliferation in vitro and in vivo. In a recent study, inhibition of glutamine anaplerosis with GLS-1 inhibitor CB-839 reduced the growth of primary osteosarcoma progression and metastasis progression in mouse (37). Our results also suggest a high glutamine demand in progressive osteosarcoma cases, as the H-score levels were significantly higher in those patients who died due to relapse or progression.
Some tumors are dependent on lipids for their progression and survival (38). The characterization of lipid metabolism was also performed in this study. According to our results, high expression of CPT1A suggests that fatty acid beta oxidation may play an important role in osteosarcoma metabolism. Pharmacological inhibition of CPT1A with etomoxir was mostly used in research, but some experiments also indicated promising anti-tumor results (39). Previous experimental evidence has suggested that fatty acid synthase (FASN) may be involved in cancer metastasis, and have been investigated as a therapeutic target (40, 41). The role of FASN in progression and metastasis development in osteosarcoma was demonstrated in previous studies (42). In our study, the expression of FASN was significantly higher in metastatic cases and in patients who died, than those without metastasis and who survived, showing similar results to previous studies (43). This result suggests that FASN might play a role in metastasis development in osteosarcoma.
We also investigated the correlations between metabolic markers and mTOR activity. We found positive correlation between pmTOR and GLS, PFK, and ATPB, suggesting that activated mTOR enhances the activity of certain metabolic pathways as a master regulator. Similar findings were described in pediatric rhabdomyosarcoma as well (44).
Despite the low number of cases available for our studies, our results emphasize the importance of metabolic alterations of osteosarcoma cells. Further investigation of metabolic plasticity may lead to better understanding of therapy resistance and new ways of targeted therapies. Our results indicate potential targets for therapy, but it is still unknown whether it would result in a clinically significant outcome.
In conclusion—based on our results—we suggest performing detailed mTOR profile characterization before administering mTOR inhibitor therapy for osteosarcoma patients. mTOR activation is linked to several metabolic pathways, such as enhanced glycolysis, oxidative phosphorylation, and glutamine demand. These findings may be an explanation of therapeutic failure in this malignancy. Overexpression of GLS and FASN may be a prognostic factor in survival.
Statements
Data availability statement
The raw data supporting the conclusion of this article will be made available by the authors, without undue reservation.
Ethics statement
The studies involving human participants were reviewed and approved by Ethics and Scientific Committee of Semmelweis University (project identification code: 99/2018). Written informed consent from the participants’ legal guardian/next of kin was not required to participate in this study in accordance with the national legislation and the institutional requirements.
Author contributions
All authors listed contributed significantly to the design of the investigation. Conceptualization: AM, ZV, AS, and MC; Data curation: AM; Methodology: AM, LF, IK, DK, and DM; Validation: IK; Investigation: AM, LF, DK, DM, and IK; Resources: AS and MC; Writing—original draft preparation: AM; Writing—review and editing: IK, LF, AS, and MC; Supervision: AS and MC; Project administration: AM; Funding acquisition: AS and MC. All authors have read and agreed to the published version of the manuscript.
Conflict of interest
The authors declare that the research was conducted in the absence of any commercial or financial relationships that could be construed as a potential conflict of interest.
References
1.
Pizzo PA Poplack DG . Principles and Practice of Pediatric Oncology. 7th ed.Philadelphia PA ,USA: Lippincott Williams and Wilkins (2015).
2.
Smeland S Bielack SS Whelan J Bernstein M Hogendoorn P Krailo MD et al Survival and Prognosis with Osteosarcoma: Outcomes in More Than 2000 Patients in the EURAMOS-1 (European and American Osteosarcoma Study) Cohort. Eur J Cancer (2019) 109:36–50. 10.1016/j.ejca.2018.11.027
3.
Coller HA . Is Cancer a Metabolic Disease?Am J Pathol (2014) 184(1):4–17. 10.1016/j.ajpath.2013.07.035
4.
Mossmann D Park S Hall MN . mTOR Signalling and Cellular Metabolism Are Mutual Determinants in Cancer. Nat Rev Cancer (2018) 18(12):744–57. 10.1038/s41568-018-0074-8
5.
Wan X Helman LJ . The Biology behind mTOR Inhibition in Sarcoma. The Oncologist (2007) 12:1007–18. 10.1634/theoncologist.12-8-1007
6.
Wander SA Hennessy BT Slingerland JM . Next-generation mTOR Inhibitors in Clinical Oncology: How Pathway Complexity Informs Therapeutic Strategy. J Clin Invest (2011) 121(4):1231–41. 10.1172/jci44145
7.
Zhou Q Deng Z Zhu Y Long H Zhang S Zhao J . mTOR/p70S6K Signal Transduction Pathway Contributes to Osteosarcoma Progression and Patients' Prognosis. Med Oncol (2010) 27:1239–45. 10.1007/s12032-009-9365-y
8.
Perry JA Kiezun A Tonzi P Van Allen EM Carter SL Baca SC et al Complementary Genomic Approaches Highlight the PI3K/mTOR Pathway as a Common Vulnerability in Osteosarcoma. Proc Natl Acad Sci U S A (2014) 111:E5564–73. 10.1073/pnas.1419260111
9.
Wang X Lai P Zhang Z Huang M Wang L Yin M et al Targeted Inhibition of mTORC2 Prevents Osteosarcoma Cell Migration and Promotes Apoptosis. Oncol Rep (2014) 32:382–8. 10.3892/or.2014.3182
10.
Fleuren EDG Versleijen-Jonkers YMH Roeffen MHS Franssen GM Flucke UE Houghton PJ et al Temsirolimus Combined with Cisplatin or Bevacizumab Is Active in Osteosarcoma Models. Int J Cancer (2014) 135:2770–82. 10.1002/ijc.28933
11.
Horie R Nakamura O Yamagami Y Mori M Nishimura H Fukuoka N et al Apoptosis and Antitumor Effects Induced by the Combination of an mTOR Inhibitor and an Autophagy Inhibitor in Human Osteosarcoma MG63 Cells. Int J Oncol (2015) 48:37–44. 10.3892/ijo.2015.3227
12.
Hu K Dai H-B Qiu Z-L . mTOR Signaling in Osteosarcoma: Oncogenesis and Therapeutic Aspects (Review). Oncol Rep (2016) 36:1219–25. 10.3892/or.2016.4922
13.
Wagner LM Fouladi M Ahmed A Krailo MD Weigel B DuBois SG et al Phase II Study of Cixutumumab in Combination with Temsirolimus in Pediatric Patients and Young Adults with Recurrent or Refractory Sarcoma: A Report from the Children's Oncology Group. Pediatr Blood Cancer (2015) 62:440–4. 10.1002/pbc.25334
14.
Whelan JS Bielack SS Marina N Smeland S Jovic G Hook JM et al EURAMOS-1, an International Randomised Study for Osteosarcoma: Results from Pre-randomisation Treatment. Ann Oncol (2015) 26:407–14. 10.1093/annonc/mdu526
15.
Adamo B Deal AM Burrows E Geradts J Hamilton E Blackwell KL . Phosphatidylinositol 3-kinase Pathway Activation in Breast Cancer Brain Metastases. Breast Cancer Res (2011) 13:125. 10.1186/bcr3071
16.
Krencz I Sebestyén A Fábián K Márk Á Moldvay J Khoor A . Expression of mTORC1/2-Related Proteins in Primaryand Brain Metastatic Lung Adenocarcinoma. Hum Pathol (2017) 62:66–73. 10.1016/j.humpath.2016.12.012
17.
Ottaviani G . The Epidemiology of Osteosarcoma. Cancer Trear Res (2009) 152:3–13. 10.1007/978-1-4419-0284-9_1
18.
Zhu YR Min H . Activity of the Novel Dual Phosphatidylinositol 3-kinase/mammalian Target of Rapamycin Inhibitor NVP-Bez235 against Osteosarcoma. Canc Biol Ther (2015) 602–9. 10.1080/15384047.2015.1017155
19.
Hu X . The Anti-osteosarcoma Cell Activity by a mTORC1/2 Dual inhibitorRES-529. Biochem Biophysical Res Commun (2018) 497:499–505. 10.1016/j.bbrc.2018.02.050
20.
Gazouli I Kyriazoglou A Kotsantis I Anastasiou M Pantazopoulos A Prevezanou M et al Systematic Review of Recurrent Osteosarcoma Systemic Therapy. Cancers (2021) 13:1757. 10.3390/cancers13081757
21.
Grignani G . Sorafenib and Everolimus for Patients with Unresectable High-Grade Osteosarcoma Progressing after Standard Treatment: a Non-randomised Phase 2 Clinical Trial. Lancet Oncol (2015) 16:98–107. 10.1016/s1470-2045(14)71136-2
22.
Martin-Broto J Redondo A Valverde C Vaz MA Mora J Garcia del Muro X et al Gemcitabine Plus Sirolimus for Relapsed and Progressing Osteosarcoma Patients after Standard Chemotherapy: a Multicenter, Single-Arm Phase II Trial of Spanish Group for Research on Sarcoma (GEIS). Ann Oncol (2017) 28:2994–9. 10.1093/annonc/mdx536
23.
Wan X Mendoza A Khanna C Helman LJ . Rapamycin Inhibits Ezrin-Mediated Metastatic Behavior in a Murine Model of Osteosarcoma. Cancer Res (2005) 65(6):2406–11. 10.1158/0008-5472.can-04-3135
24.
Krencz I Anna S Fábián K Márk Á Moldvay J Khoor A et al Expression of mTORC1/2-Related Proteins in Primary and Brain Metastatic Lung Adenocarcinoma. Hum Pathol(2017) 62:66–73. 10.1016/j.humpath.2016.12.012
25.
Hegyi M Semsei AF Jakab Z Antal I Kiss J Szendroi M et al Good Prognosis of Localized Osteosarcoma in Young Patients Treated with Limb-Salvage Surgery and Chemotherapy. Pediatr Blood Cancer (2011) 57(3):415–22. 10.1002/pbc.23172
26.
Spraker-Perlman HL Barkauskas DA Krailo MD Meyers PA Schwartz CL Doski J et al Factors Influencing Survival after Recurrence in Osteosarcoma: A Report from the Children’s Oncology Group. Pediatr Blood Cancer (2019) 66(1):e27444. 10.1002/pbc.27444
27.
Kennedy BK Lamming DW . The Mechanistic Target of Rapamycin: The Grand ConducTOR of Metabolism and Aging. Cell Metab. . (2016) 23:990–1003. 10.1016/j.cmet.2016.05.009
28.
Saxton RA Sabatini DM . mTOR Signaling in Growth, Metabolism, and Disease. Cell(2017) 169:361–71. 10.1016/j.cell.2017.03.035
29.
Pavlova NN Thompson CB . The Emerging Hallmarks of Cancer Metabolism. Cell Metab (2016) 23:27–47. 10.1016/j.cmet.2015.12.006
30.
Mizushima E Torigoe T . Osteosarcoma-initiating Cells Show High Aerobic Glycolysis and Attenuation of Oxidative Phosphorylation Mediated by LIN28B. Cancer Sci (2020) 111:36–46. 10.1111/cas.14229
31.
Giang A-H Raymond T Paul B de Mesy Bentley K Schwarz E O’Keefe R et al Mitochondrial Dysfunction and Permeability Transition inOsteosarcoma Cells Showing the Warburg Effect. J Biol Chem (2013) 288:33303–11. 10.1074/jbc.m113.507129
32.
Bonuccelli G Avnet S Grisedni G Salerno M Granchi D Dominici M et al Role of Mesenchymal Stem Cells in Osteosarcoma and Metabolic Reprogramming of Tumor Cells. Oncotarget (2017) 5:7575–88. 10.18632/oncotarget.2243
33.
Wang J Yuan W Chen Z Wu S Chen J Ge J et al Overexpression of G6PD Is Associated with Poor Clinical Outcome in Gastric Cancer. Tumour Biol (2012) 33(1):95–101. 10.1007/s13277-011-0251-9
34.
Fan TW Kucia M Jankowski K Higashi RM Ratajczak J Ratajczak MZ et al Rhabdomyosarcoma Cells Show an Energy Producing Anabolic Metabolic Phenotype Compared with Primary Myocytes. Mol Cancer (2008) 7:79. 10.1186/1476-4598-7-79
35.
Wang X Chen K Zhao Z . LncRNA OR3A4 Regulated the Growth of Osteosarcoma Cells by Modulating the miR-1207- 5p/G6PD Signaling. OncoTargets Ther (2020) 13:3117–28. 10.2147/ott.s234514
36.
Altman BJ Stine ZE Dang CV . From Krebs to Clinic: Glutamine Metabolism to Cancer Therapy. Nat Rev Cancer (2016) 16(10):619–34. 10.1038/nrc.2016.71
37.
Ren L Ruiz-Rodado V Dowdy T Huang S Issaq SH Beck J et al Glutaminase-1 (GLS1) Inhibition Limits Metastatic Progression in Osteosarcoma. Cancer Metab (2020) 8:4. 10.1186/s40170-020-0209-8
38.
Beloribi-Djefaflia S Vasseur S Guillaumond F . Lipid Metabolic Reprogramming in Cancer Cells. Oncogenesis (2016) 5:e189. 10.1038/oncsis.2015.49
39.
Tan Z Xiao L Tang M Bai F Li J Li L . Targeting CPT1A-Mediated Fatty Acid Oxidation Sensitizes Nasopharyngeal Carcinoma to Radiation Therapy. Theranostics (2018) 8:2329–47. 10.7150/thno.21451
40.
Alo PL Amini M Piro F . Immunohistochemical Expression and Prognostic Significance of Fatty Acid Synthase in Pancreatic Carcinoma. Anticancer Res (2007) 27:2523–7.
41.
Orita H Coulter J Tully E . Inhibiting Fatty Acid Synthase for Chemoprevention of Chemically Induced Lung Tumors. Clin Cancer Res (2008) 14:2458–64. 10.1158/1078-0432.ccr-07-4177
42.
Chen XY Ruan HB Long XH Peng AF Zhou LD Liu M et al Blocking Fatty Acid Synthase Inhibits Tumor Progression of Human Osteosarcoma by Regulating the Human Epidermal Growth Factor Receptor 2/phosphoinositide 3-kinase/protein Kinase B Signaling Pathway in Xenograft Models. Exp Ther Med (2017) 13(5):2411–6. 10.3892/etm.2017.4284
43.
Liu ZL Wang G Peng AF Luo QF Zhou Y Huang SH . Fatty Acid Synthase Expression in Osteosarcoma and its Correlation with Pulmonary Metastasis. Oncol Lett (2012) 4(5):878–82. 10.3892/ol.2012.862
44.
Felkai L Krencz I Nagy N Petővári G Dankó T Micsík T et al Characterization of mTOR Activity and Metabolic Profile in Pediatric Rhabdomyosarcoma. Cancers(2020) 12:1947. 10.3390/cancers12071947
Summary
Keywords
osteosarcoma, mTOR, pathways, metabolic, metabolic adaptation, pediatric
Citation
Mohás A, Krencz I, Váradi Z, Arató G, Felkai L, Kiss DJ, Moldvai D, Sebestyén A and Csóka M (2022) In Situ Analysis of mTORC1/C2 and Metabolism-Related Proteins in Pediatric Osteosarcoma. Pathol. Oncol. Res. 28:1610231. doi: 10.3389/pore.2022.1610231
Received
02 December 2021
Accepted
01 March 2022
Published
22 March 2022
Volume
28 - 2022
Edited by
Andrea Ladányi, National Institute of Oncology (NIO), Hungary
Updates
Copyright
© 2022 Mohás, Krencz, Váradi, Arató, Felkai, Kiss, Moldvai, Sebestyén and Csóka.
This is an open-access article distributed under the terms of the Creative Commons Attribution License (CC BY). The use, distribution or reproduction in other forums is permitted, provided the original author(s) and the copyright owner(s) are credited and that the original publication in this journal is cited, in accordance with accepted academic practice. No use, distribution or reproduction is permitted which does not comply with these terms.
*Correspondence: Anna Mohás, mohas.anna@med.semmelweis-univ.hu; Monika Csóka, csoka.monika@med.semmelweis-univ.hu
Disclaimer
All claims expressed in this article are solely those of the authors and do not necessarily represent those of their affiliated organizations, or those of the publisher, the editors and the reviewers. Any product that may be evaluated in this article or claim that may be made by its manufacturer is not guaranteed or endorsed by the publisher.