Abstract
RICTOR gene, which encodes the scaffold protein of mTORC2, can be amplified in various tumor types, including squamous cell carcinoma (SCC) of the lung. RICTOR amplification can lead to hyperactivation of mTORC2 and may serve as a targetable genetic alteration, including in lung SCC patients with no PD-L1 expression who are not expected to benefit from immune checkpoint inhibitor therapy. This study aimed to compare RICTOR amplification detected by fluorescence in situ hybridization (FISH) with Rictor and PD-L1 protein expression detected by immunohistochemistry (IHC) in SCC of the lung. The study was complemented by analysis of the publicly available Lung Squamous Cell Carcinoma (TCGA, Firehose legacy) dataset. RICTOR amplification was observed in 20% of our cases and 16% of the lung SCC cases of the TCGA dataset. Rictor and PD-L1 expression was seen in 74% and 44% of the cases, respectively. Rictor IHC showed two staining patterns: membrane staining (16% of the cases) and cytoplasmic staining (58% of the cases). Rictor membrane staining predicted RICTOR amplification as detected by FISH with high specificity (95%) and sensitivity (70%). We did not find any correlation between RICTOR amplification and PD-L1 expression; RICTOR amplification was detected in 18% and 26% of PD-L1 positive and negative cases, respectively. The TCGA dataset analysis showed similar results; RICTOR copy number correlated with Rictor mRNA and protein expression but showed no association with PD-L1 mRNA and protein expression. In conclusion, the correlation between RICTOR amplification and Rictor membrane staining suggests that the latter can potentially be used as a surrogate marker to identify lung SCC cases with RICTOR amplification. Since a significant proportion of PD-L1 negative SCC cases harbor RICTOR amplification, analyzing PD-L1 negative tumors by RICTOR FISH or Rictor IHC can help select patients who may benefit from mTORC2 inhibitor therapy.
Introduction
Despite the significant advances that have been made in the diagnosis and treatment of non-small cell lung cancer (NSCLC) in the past decades, it remains the leading cause of cancer death worldwide [1]. Among NSCLCs, squamous cell carcinoma (SCC) is one of the most common histological subtypes, accounting for 30%–35% of all NSCLC cases [2].
Lung SCC is strongly associated with tobacco smoking and arises mostly in the central part of the lungs [3]. There is growing evidence that it is more heterogeneous than it is suggested by its three histologic subtypes (keratinizing, non-keratinizing, and basaloid) [4].
While there have been significant breakthroughs in targeted therapies for lung adenocarcinoma, most patients with advanced SCC are treated with immune checkpoint inhibitors (ICIs), platinum-based chemotherapy, or a combination of the two [5]. For SCCs with no PD-L1 expression, platinum-based chemotherapy remains the main treatment option [6]. Therefore, there is an urgent need to develop new targeted therapies for patients with SCC.
Protein complexes mTOR complex 1 (mTORC1) and mTOR complex 2 (mTORC2) are integral components of the phosphatidylinositol 3-kinase (PI3K)/protein kinase B (Akt)/mammalian target of rapamycin (mTOR) pathway. The main functions of mTORC1 include the regulation of cell growth and proliferation, whereas mTORC2 plays essential roles in cytoskeletal reorganization and cell survival [7]. Rictor (encoded by the RICTOR gene) is the scaffold protein of mTORC2 (Figure 1). Amplification of RICTOR has been reported in various cancer types, including approximately 10% of lung SCCs [8–10]. Like PIK3CA copy number gain and PTEN loss, RICTOR amplification affects the PI3K/Akt/mTOR pathway. PIK3CA copy number gain and PTEN loss mostly alter mTORC1 activity, whereas RICTOR amplification primarily results in the alteration of mTORC2 [11].
FIGURE 1
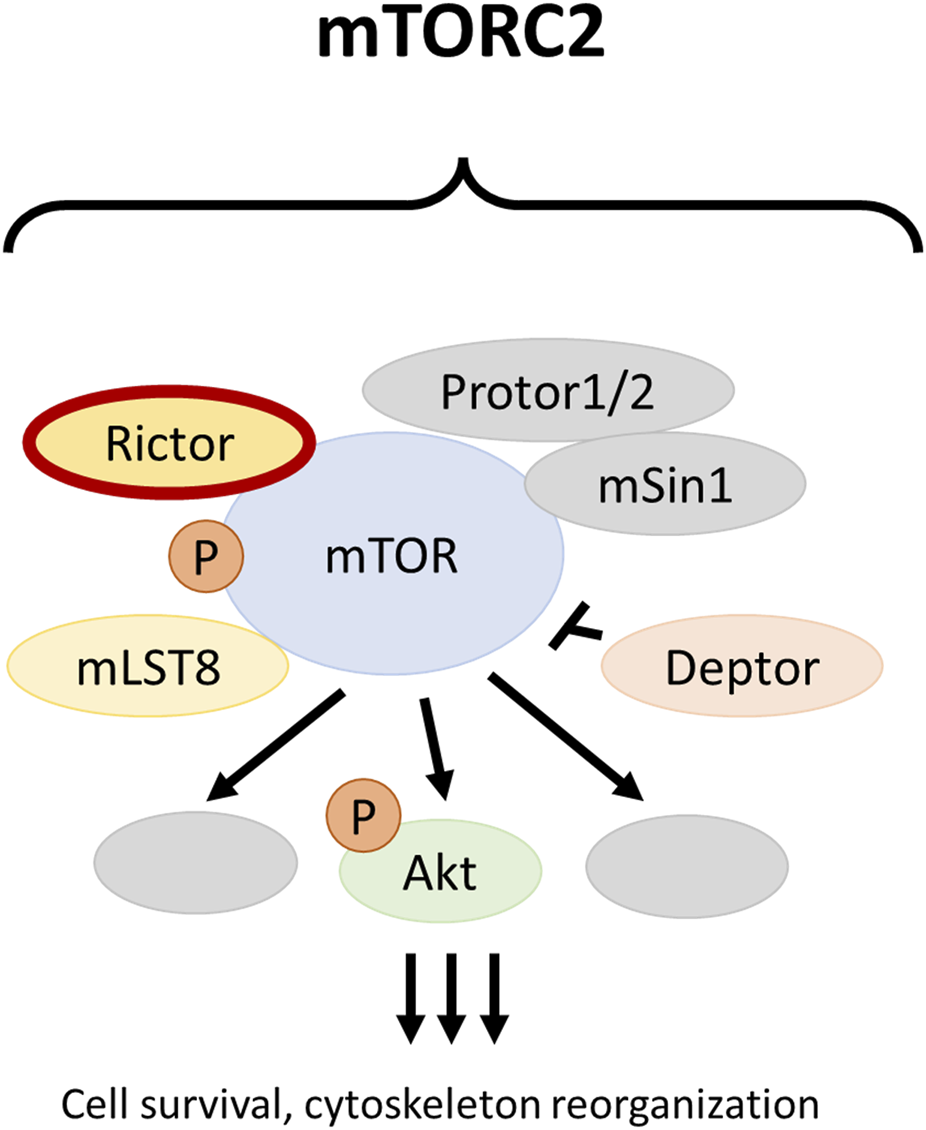
The mTOR complex 2. The RICTOR gene encodes for the scaffold protein of mTORC2 and can be amplified in different malignancies, including squamous cell carcinoma of the lung.
RICTOR fluorescence in situ hybridization (FISH) is considered the diagnostic standard for the detection of RICTOR amplification [8]. Immunohistochemistry (IHC) is an acceptable, cost-effective alternative to detect certain molecular alterations, including ALK and ROS1 rearrangements [12, 13]. However, Rictor IHC has never been compared to RICTOR FISH in the SCC of the lung.
The purpose of this study was to compare RICTOR amplification as detected by FISH with Rictor expression as detected by IHC in SCC of the lung. Since PD-L1 negative tumors are typically ineligible for immune checkpoint inhibitor therapy, finding a potentially targetable genetic alteration such as RICTOR amplification is especially important for patients with PD-L1 negative advanced SCC. Therefore, we also examined the relationship between RICTOR amplification and PD-L1 expression in these tumors.
Materials and methods
Patients
A total of 50 samples, including 40 surgical resection specimens and 10 small biopsies of lung SCC cases diagnosed between 1 January 2002 and 31 July 2020 were analyzed in our study. Only primary tumors with SCC histology were included. The tumors were re-reviewed and reclassified according to the 2021 World Health Organization Classification of Thoracic Tumors [14]. None of the patients received neoadjuvant therapy before surgery or biopsy. Clinicopathological data are summarized in Table 1. The study was approved by the Mayo Clinic Institutional Review Board (ID: 18-001887) and the Institutional Ethical Review Board of Semmelweis University (SE KREB 216/2020).
TABLE 1
| Characteristics | N (%) | |
|---|---|---|
| Total no. of the cases | 50 (100%) | |
| Age | <65 years | 12 (24%) |
| ≥65 years | 38 (76%) | |
| Sex | Male | 30 (60%) |
| Female | 20 (40%) | |
| Histological subtype | Non-keratinizing | 31 (62%) |
| Keratinizing | 16 (32%) | |
| Basaloid | 3 (6%) | |
| Grade | Grade 1 | 1 (2%) |
| Grade 2 | 33 (66%) | |
| Grade 3 | 16 (32%) | |
| Stage | IA-B | 25 (50%) |
| IIA-B | 10 (20%) | |
| IIIA-B | 9 (18%) | |
| N.A. | 6 (12%) | |
| Procedure | Surgical resection | 40 (80%) |
| Small biopsy | 10 (20%) | |
Clinicopathological data.
Abbreviations: N.A., not available.
Fluorescence in situ hybridization reaction
FISH was performed on 4–µm–thick sections of the formalin-fixed paraffin-embedded tissue blocks. After pretreatment with Vysis IntelliFISH Pretreatment SSC Solution (Abbott Molecular, Des Plaines, IL, United States) at 79°C for 25 min, deparaffinized sections were digested using Vysis IntelliFISH Protease (Abbott Molecular) at 38°C for 25 min. Sections were then exposed to a mixture of RICTOR (#RICTOR-20-OR; Empire Genomics, Buffalo, NY, United States, labeled in orange) and chromosome 5 (Chr5) control (#CHR05-10-GR; Empire Genomics, labeled in green) probes and Vysis IntelliFISH Hybridization Buffer (Abbott Molecular) at 37°C for 2 h. Posthybridization wash was performed at 73°C for 3 min (Vysis IntelliFISH Post-Hybridization Buffer; Abbott Molecular). After air drying, sections were counterstained with DAPI I (Abbott Molecular).
Fluorescence in situ hybridization analysis
Slides were examined under a fluorescence microscope (DM5500 B; Leica, Wetzlar, Germany) focusing on hot spot areas. For each tumor, 30 tumor cell nuclei were evaluated in at least 2 different areas by 2 technicians. Both the mean number of signals per nucleus and the RICTOR/Chr5 control ratio were determined. A RICTOR copy number of 4 or more and a RICTOR/Chr5 ratio of 2 or more were considered positive for RICTOR amplification. Otherwise, the case was considered negative (see Figure 2). Images were captured using CytoVision software (Leica).
FIGURE 2
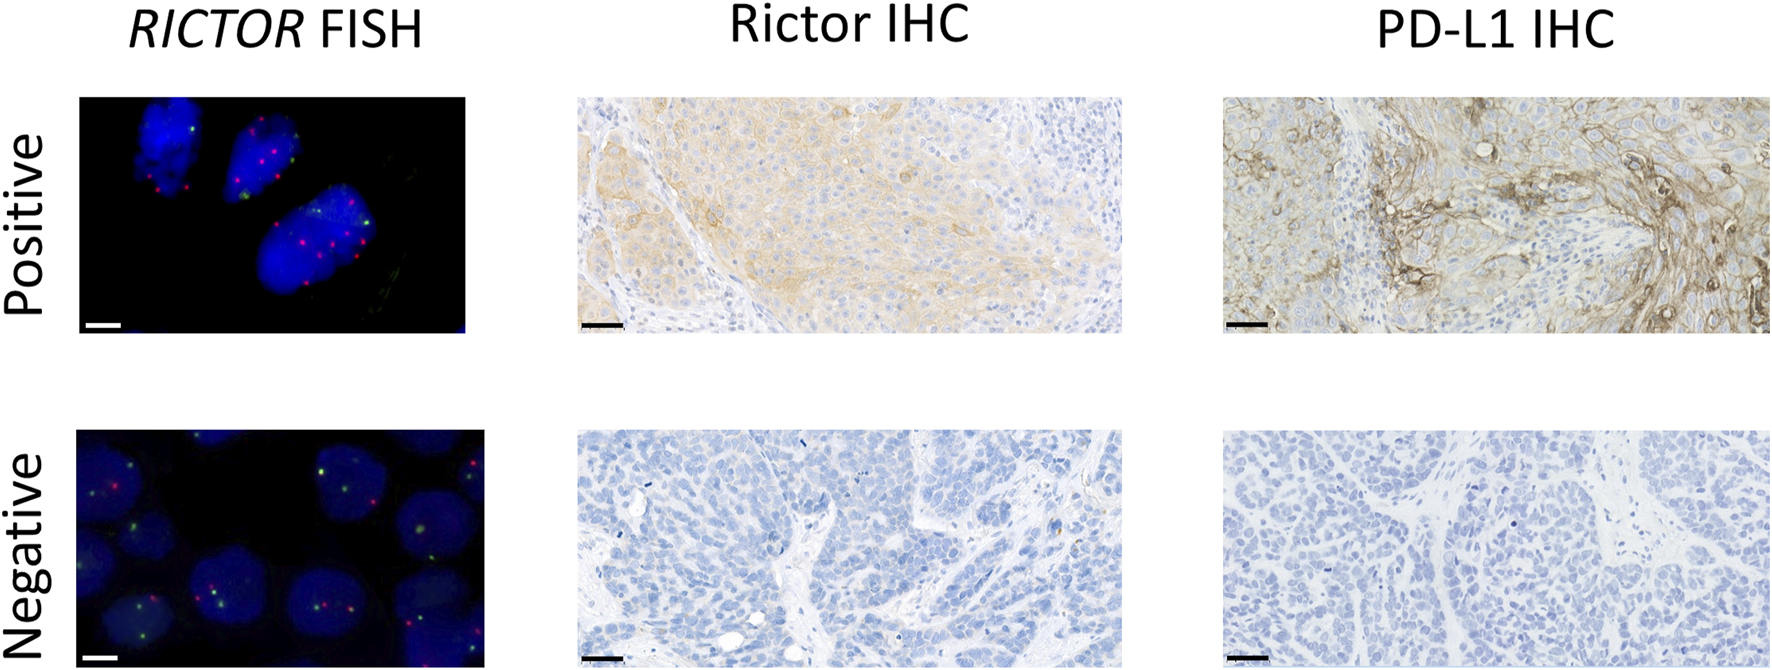
Representative images of RICTOR FISH, Rictor IHC, and PD-L1 IHC in lung SCC cases. Representative images of RICTOR FISH (RICTOR and Chr5 are labeled in orange and green, respectively), Rictor IHC, and PD-L1 IHC in lung SCC cases. The scale bar indicates 10 μm on FISH and 50 μm on IHC images.
Immunohistochemical staining
Rictor IHC was performed on 4–µm–thick sections of the same blocks. After deparaffinization and blocking endogenous peroxidases, antigen retrieval was performed for 30 min (10 mM citrate, pH 6.0) in a pressure cooker. Slides were then incubated with an anti-Rictor (1:1000; #A500-002A; Bethyl Laboratories, Montgomery, TX, United States) primary antibody. Vectastain Universal Elite ABC HRP Kit (Vector Laboratories, Newark, CA, United States) secondary detection system and DAB (Agilent, Santa Clara, CA, United States) chromogen were used to visualize the reactions. The sections were counterstained with hematoxylin.
PD-L1 IHC 22C3 PharmDx reactions were performed on an automated immunostainer (Leica BOND-III; Leica) using the EnVision FLEX visualization system (Agilent) according to the manufacturer’s protocols.
Evaluation of immunohistochemistry
PD-L1 membrane expression was assessed using Tumor Proportion Score (TPS) and was classified into TPS < 1%, TPS 1%–49%, and TPS ≥ 50% categories [15, 16]. A TPS ≥ 1% was considered positive (see Figure 2).
Since there had been no standardized way of analyzing Rictor expression, we evaluated both membrane and cytoplasmic stainings. In the presence of any membrane positivity, the pattern was considered membrane staining. The percentage of stained tumor cells was categorized similarly to that of PD-L1, using TPS < 1%, TPS 1%–49%, and TPS ≥ 50% categories.
Data collection from the cancer genome atlas
Correlations among copy number alterations for RICTOR as well as mRNA (mRNA Seq V2 RSEM) and protein (reverse-phase protein array, RPPA) expression of Rictor and PD-L1 (CD274) was analyzed in the Lung Squamous Cell Carcinoma (TCGA, Firehose Legacy) dataset [17, 18]. The dataset contains the data of 511 lung SCC patients and was accessed through cBioPortal (accessed on 30th March 20231). The association between RICTOR amplification and clinicopathological data was also studied.
Statistical analysis
Statistical analysis was performed using IBM SPSS Statistics software (version 22; SPSS Inc., Chicago, IL, United States). Descriptive data are expressed as numbers (percentages). Associations with the clinicopathological data were analyzed by the chi-square test. Correlations were evaluated using Spearman correlation. The Kaplan-Meier method was used for the survival analysis. The mean follow-up time was 1,091 days. Survival curves were compared by the log-rank method. A p ≤ 0.05 was defined as statistically significant.
Results
RICTOR amplification in lung SCC
RICTOR amplification was observed in 10 of 50 cases (20%). The mean (range) RICTOR copy number per tumor cells was 6.26 (4.48–9.69) in the amplified cases and 2.90 (1.62–4.20) in the non-amplified cases. The mean (range) Chr5 copy number per tumor cells was 1.97 (1.27–2.89) in the amplified cases and 1.64 (1.10–2.52) in the non-amplified cases.
Immunohistochemical expression of Rictor in lung SCC
Assessment of Rictor staining had not been standardized previously. Therefore, we separately analyzed membrane staining (Figure 3A) and cytoplasmic staining (Figure 3B) in our study. Membrane staining was observed in 8 cases (16%) and cytoplasmic staining in 29 cases (58%) (Table 2). No Rictor expression was seen in 13 cases (26%).
FIGURE 3
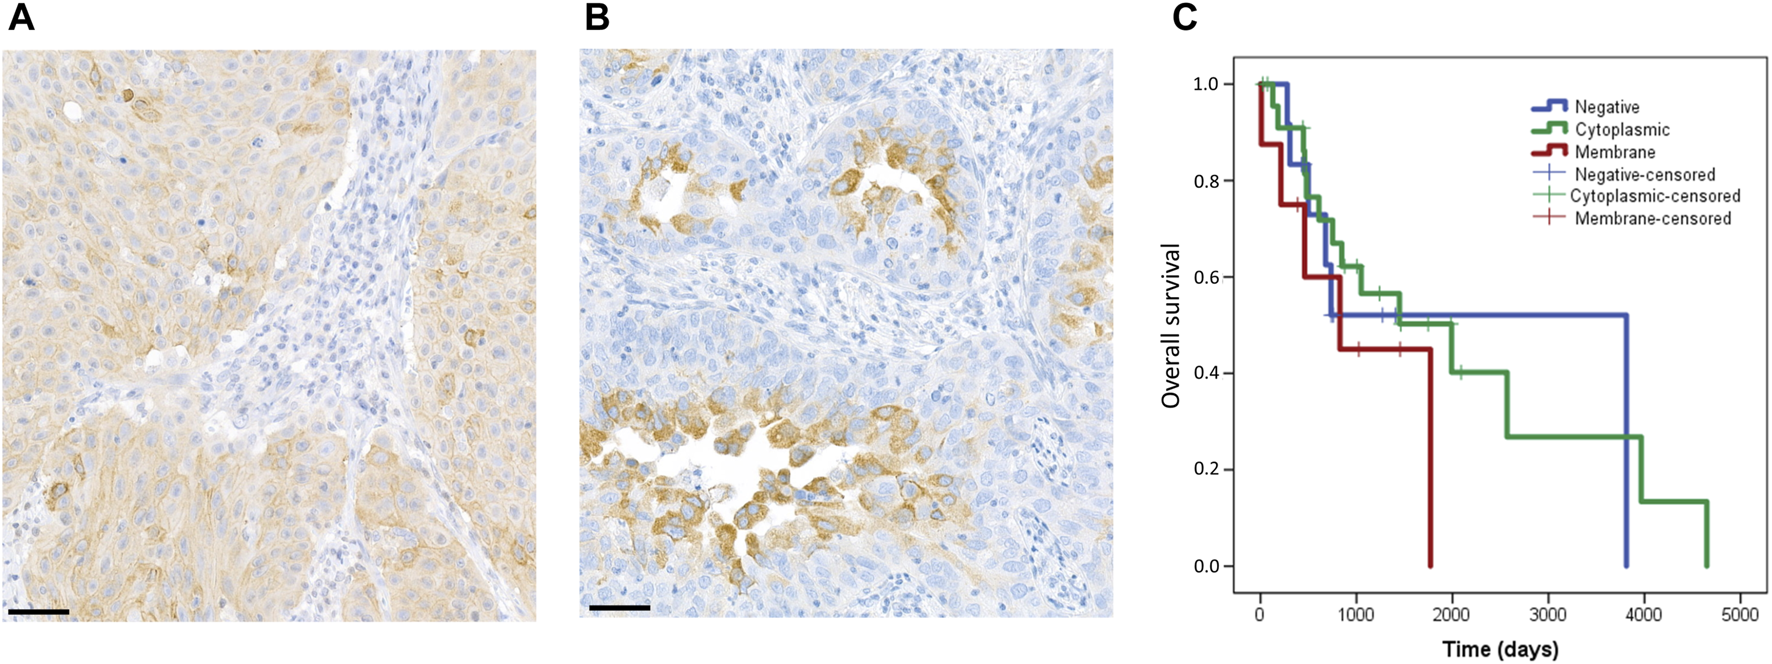
Staining pattern of the Rictor protein and correlation with patient’s overall survival. In our study, we evaluated membrane and cytoplasmic staining separately. The figure shows representative images for membrane (A) and cytoplasmic (B) staining. The scale bar indicates 50 μm. Correlation of Rictor staining pattern with overall survival of patients (C). Rictor membrane staining (red) was associated with slightly shorter overall survival as compared to cytoplasmic staining (green) and negative cases (blue).
TABLE 2
| Rictor expression | TPS (%) | N (%) |
|---|---|---|
| Negative | <1 | 13 (26) |
| Positive membrane | 1–49 | 3 (6) |
| ≥50 | 5 (10) | |
| Positive cytoplasmic | 1–49 | 27 (54) |
| ≥50 | 2 (4) | |
| Total | 50 (100) |
Immunohistochemical expression of Rictor in squamous cell carcinoma.
Immunohistochemical expression of PD-L1 in lung SCC
IHC for PD-L1 was positive in 22 of 50 cases (44%) (Table 3). TPS was 1%–49% in 17 cases and was ≥50% in 5 cases. The remaining 28 cases (56%) were negative.
TABLE 3
| PD-L1 expression | TPS (%) | N (%) |
|---|---|---|
| Negative | <1 | 28 (56) |
| Positive | 1–49 | 17 (34) |
| ≥50 | 5 (10) | |
| Total | 46 (100) |
Immunohistochemical expression of PD-L1 in squamous cell carcinoma.
Concordance between RICTOR FISH and Rictor expression
The sensitivity, specificity, and negative and positive predictive values of various Rictor staining patterns are shown in Table 4. Rictor membrane staining showed the highest specificity for RICTOR amplification (95%). The negative predictive value of Rictor membrane staining was also high (93%).
TABLE 4
| Rictor membrane staining (%) | Rictor cytoplasmic staining (%) | Any Rictor staining (%) | |
|---|---|---|---|
| Sensitivity | 70 | 20 | 90 |
| Specificity | 95 | 35 | 30 |
| Negative predictive value | 93 | 64 | 92 |
| Positive predictive value | 78 | 7 | 24 |
Concordance of RICTOR FISH and Rictor immunohistochemical results.
Concordance between RICTOR FISH/Rictor expression and PD-L1 expression
RICTOR amplification was detected in 4 (18%) PD-L1 positive cases and 5 (26%) PD-L1 negative cases, and there was no correlation between RICTOR amplification and PD-L1 expression. Similarly, we found no significant correlation between Rictor and PD-L1 expression.
Correlation of RICTOR amplification, Rictor and PD-L1 expression with clinicopathological data and survival
Neither FISH, nor immunohistochemical results showed a correlation with clinicopathological data (including age, sex, histological subtype, grade, and stage). Patients with Rictor membrane staining had a slightly shorter overall survival as compared to patients with Rictor cytoplasmic staining (p = 0.229) or no Rictor staining (p = 0.505) (Figure 3C). However, these results were not statistically significant. RICTOR amplification and PD-L1 expression did not correlate with survival.
Associations between RICTOR amplification, Rictor, and PD-L1 mRNA and protein expression in the lung squamous cell carcinoma (TCGA, Firehose Legacy) dataset
To strengthen our results, we also performed a similar analysis using data from the Lung Squamous Cell Carcinoma (TCGA, Firehose Legacy) dataset (N = 511). 501 of these samples were profiled for RICTOR copy number alterations, and RICTOR amplification was seen in 16% of the cases. We observed a strong positive correlation between RICTOR copy number and RICTOR mRNA expression (Spearman’s R = 0.58, p < 0.001; 498 samples with data in both profiles, see Figure 4A). A weaker positive correlation was detected between RICTOR copy number and Rictor protein expression (Spearman’s R = 0.14, p = 0.012; 326 samples with data in both profiles, see Figure 4B). However, there was no available information about the intracellular localization of Rictor protein expression. In correlation with our FISH and immunohistochemical analysis, we found no association between RICTOR copy number and PD-L1 (CD274) mRNA expression (Spearman’s R= −0.06, p = 0.176; 498 samples with data in both profiles, see Figure 4C) or PD-L1 protein expression (Spearman’s R= −0.02, p = 0.733; 194 samples with data in both profiles, see Figure 4D).
FIGURE 4
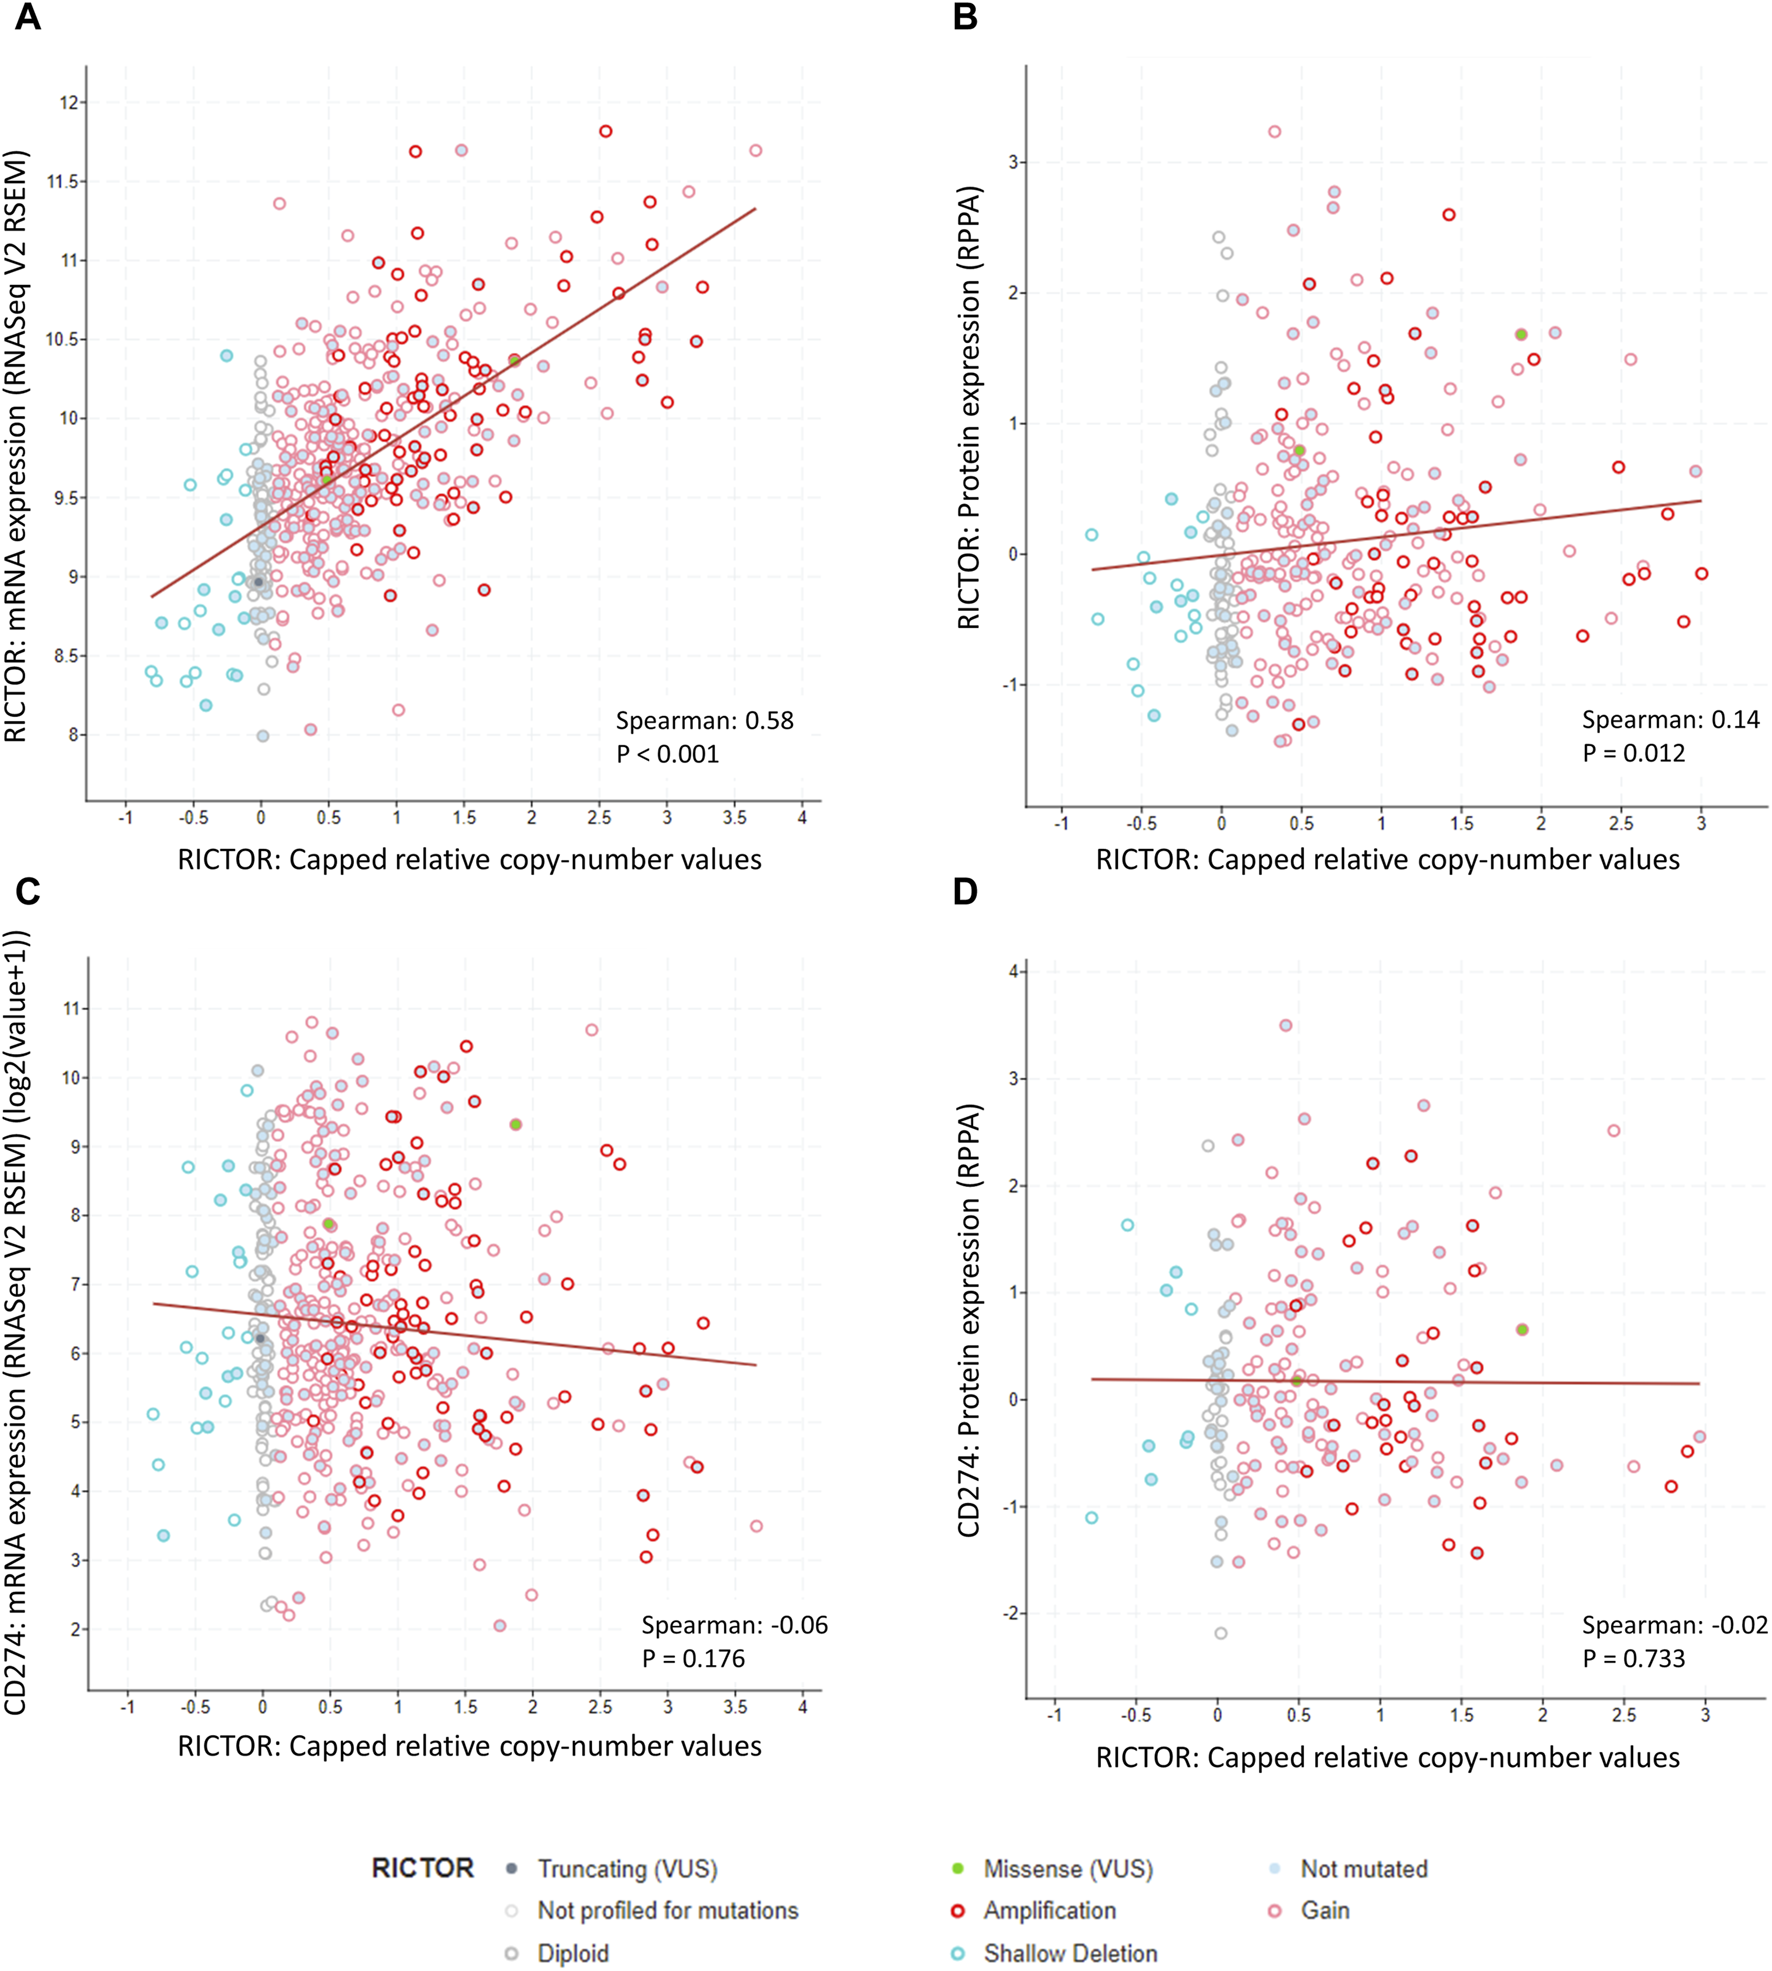
Correlation between RICTOR copy number, RICTOR and CD274 (PD-L1) mRNA, and Rictor and CD274 (PD-L1) protein expression in the Lung Squamous Cell Carcinoma (TCGA, Firehose Legacy) dataset. (A) Strong positive correlation between RICTOR copy number and RICTOR mRNA expression. (B) Weak positive correlation between RICTOR copy number and Rictor protein expression. (C) No correlation between RICTOR copy number and CD274 mRNA and (D) PD-L1 protein expression. In addition, to copy number variations, missense (2 patients, RICTOR R1299G, RICTOR E1633Q) and truncating (1 patient, RICTOR Q569*) mutations were also present in the RICTOR gene, without any known significance.
Associations between RICTOR amplification and clinicopathological data in the lung squamous cell carcinoma (TCGA, Firehose Legacy) dataset
The TCGA data analysis confirmed that there is no association between RICTOR amplification and overall survival in lung SCC patients (p = 0.201). Despite most of the cases have been categorized as Squamous Cell Carcinoma NOS based on histology (ICD-O-3: 8070/3), RICTOR amplification was seen more frequently in basaloid SCCs (6.33% of the RICTOR-amplified cases and 2.13% of the non-amplified cases had basaloid histology). In contrast, RICTOR amplification was absent in keratinizing SCCs (none of the RICTOR-amplified cases, but 3.08% of the non-amplified cases were keratinizing SCCs). Additionally, we could not find any association between RICTOR amplification and any other genetic drivers (ALK translocation and KRAS mutation status were available in 286 and 15 patients, respectively) or tumor mutational burden.
Discussion
This is the first study to compare RICTOR amplification and Rictor expression in human lung SCC. Using FISH, we observed RICTOR amplification in 20% of the cases. This is slightly higher than RICTOR amplification in the Lung Squamous Cell Carcinoma (TGCA, Firehose Legacy) dataset or in previous database analyses, where it has been found in 16% and 7.4%–15% of SCC cases, respectively [19, 20]. The difference among various studies may be due to differences in study populations and methods used to detect RICTOR amplification. An additional explanation for these differences is the high heterogeneity of RICTOR amplification and overexpression, which has been described previously [21] and was also found in our study. Given the potential intratumoral heterogeneity of both Rictor and PD-L1 staining [21–23], we performed both FISH and IHC analysis on whole slides of the tissue blocks, which allows for a higher probability of detecting areas of RICTOR amplification and overexpression of a heterogeneous tumor.
Rictor is the scaffold protein for mTORC2, a protein complex interconnected with the PI3K/Akt/mTOR pathway [24]. The PI3K/Akt/mTOR pathway regulates several essential cellular functions related to environmental signals, including cell proliferation, growth, homeostasis, and metabolism.
Subcellular localization of the PI3K/Akt/mTOR pathway components has been evaluated in various studies. As the first step in the pathway, PI3K generates phosphatidylinositol-3,4,5-triphosphate (PIP3), which binds the pleckstrin homology domain of Akt, recruiting it to the plasma membrane. Once Akt is localized to the plasma membrane, mTORC2 can phosphorylate its Ser473 site, thereby facilitating activation of the PI3K/Akt/mTOR pathway [20, 25, 26]. In contrast, some studies have demonstrated that mTORC2 can also phosphorylate its substrates (e.g., serum/glucocorticoid regulated kinase 1) using intracellular membranes and subcellular spaces such as the endoplasmic reticulum and the perinuclear compartment [25, 26]. Additionally, it is also known that Rictor can interact with integrin-linked kinase (ILK), a protein with a multifunctional role in cell-matrix interactions and that the Rictor-ILK complex may contribute to the phosphorylation of Akt on Ser473 [27, 28]. Consistent with these data, a recent study has described more than 200 proteins that can interact with mTORC2 and possibly regulate its activity and localization [29]. We observed both membrane and cytoplasmic staining for Rictor in our study. Interestingly, in RICTOR amplified cases, Rictor was localized primarily to the plasma membrane, whereas, in non-amplified cases, we found predominantly cytoplasmic staining consistent with intracellular localization.
Previous studies have revealed a positive correlation between RICTOR mRNA expression and DNA copy number in NSCLC [20], which was confirmed with our database analysis. Similarly, we observed a positive correlation between Rictor protein expression and RICTOR gene amplification. However, this correlation was strongly dependent on subcellular localization. Rictor membrane staining showed high specificity (95%) and moderate to high sensitivity (77%) for RICTOR amplification, whereas the specificity and sensitivity of Rictor cytoplasmic staining were much lower (38% and 11%, respectively). Therefore, our recommendation is to use Rictor membrane staining as a surrogate marker for RICTOR gene amplification.
Despite breakthroughs in targeted therapies for lung adenocarcinoma in the past decades, limited progress has been made in the treatment of lung SCC. This seems to be due to the lower frequency of targetable genetic alterations and the less favorable response to small-molecule tyrosine kinase inhibitors [30, 31]. The PI3K/Akt/mTOR pathway represents a potential therapeutic target [32]. The activity of mTORC2 can be inhibited by dual mTOR kinase inhibitors, which affect both mTORC1 and mTORC2 (e.g., vistusertib and sapanisertib). They have been used to treat various types of lung cancer, including SCC of the lung, in early-phase clinical trials [9, 11]. In most of these studies, patients have not been stratified based on the presence of RICTOR amplification. A selective mTORC2 inhibitor (JR-AB2-011), which blocks the interaction between Rictor and mTOR, is already available and has been used with promising results in preclinical trials [33, 34]. Selecting patients with RICTOR-amplified tumors may improve the results.
In advanced cases of SCC of the lung, ICIs represent the only widely used therapeutic option besides radiochemotherapy [6]. Similar to a previous study, which has found no association between gene alterations and PD-L1 expression in advanced lung SCC [35], we observed no association between PD-L1 expression, a predictive marker for the efficacy of ICIs, and RICTOR amplification or Rictor expression. RICTOR amplification occurred in PD-L1 positive and negative cases with similar frequency, suggesting that a significant number of the PD-L1 negative cases can be eligible for mTORC2 inhibitor therapy (Figure 5). Additionally, RICTOR amplification has been speculated to be responsible for the resistance against chemotherapy, tyrosine kinase inhibitors, and ICIs, leading to tumor progression in various types of cancer [36–38]. Therefore, analyzing RICTOR amplification in lung SCC patients who no longer respond to ICIs can reveal a new targetable alteration in this subpopulation of patients.
FIGURE 5
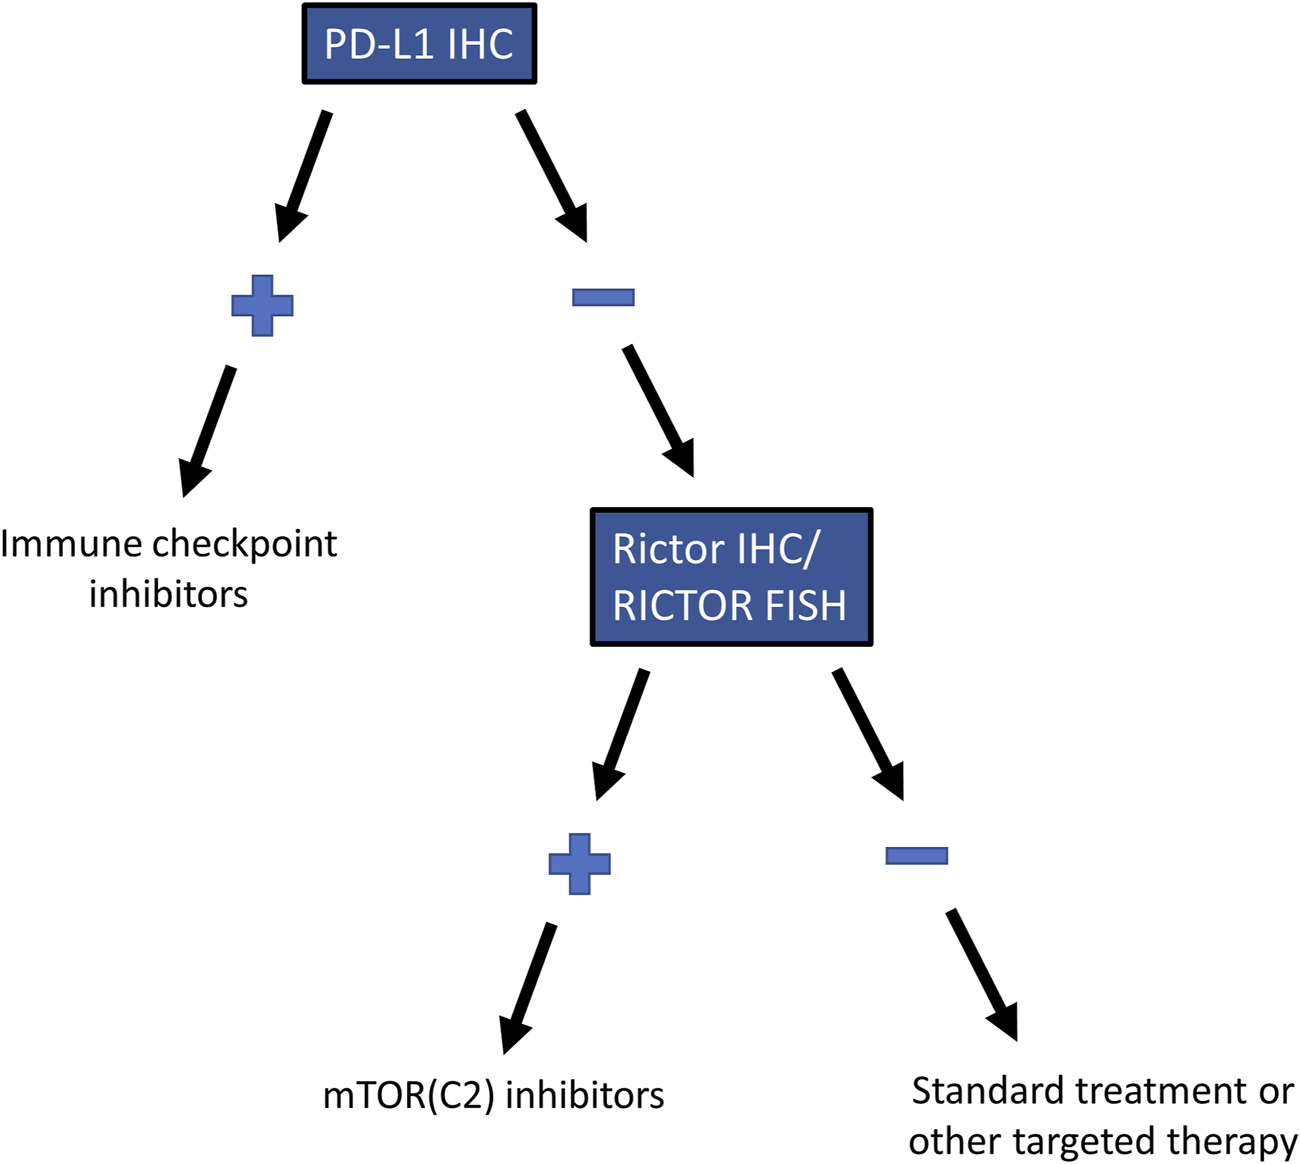
Recommended testing algorithm for RICTOR amplification in lung SCC. Testing algorithm for selecting patients with RICTOR amplification who are not eligible for immune checkpoint inhibitor treatment but may benefit from mTOR (C2) inhibitors.
Several studies have shown a correlation between mTORC2 activity and metastatic disease [33, 39, 40]. This can result in decreased survival in RICTOR-amplified cases [41]. However, similar to our previous observation in small cell lung carcinoma [8], we did not detect a significant correlation between RICTOR amplification and unfavorable clinical outcomes in SCC of the lung. Nevertheless, Rictor membrane staining, which might be directly associated with Akt phosphorylation and thereby mTORC2 activity, did show slightly lower overall survival. These results might be clarified in a study with a larger sample size focused on this particular question.
In conclusion, our findings indicate that a significant proportion of lung SCCs, including PD-L1-negative cases, harbor RICTOR amplification. Despite the initial failures in early-phase clinical trials, one of the key messages of our study is that stratifying patients based on the presence of RICTOR amplification or Rictor overexpression may improve the results. With the advent of next-generation inhibitors that can selectively target mTORC2, the importance of this topic is emerging. Rictor membrane staining can predict RICTOR amplification as detected by FISH with high specificity and sensitivity; therefore, it can potentially be used as a surrogate marker to identify RICTOR-amplified lung SCCs. Analysis of lung SCCs by RICTOR FISH or Rictor IHC, especially in PD-L1-negative cases, can help select patients who may benefit from mTORC2 inhibitor therapy.
Statements
Data availability statement
The raw data supporting the conclusion of this article will be made available by the authors, without undue reservation.
Ethics statement
The study was reviewed and approved by the Mayo Clinic Institutional Review Board (ID: 18-001887) and the Institutional Ethical Review Board of Semmelweis University (SE KREB 216/2020). Written informed consent from the patients’ legal guardian/next of kin was not required to use archived tissue blocks in this study in accordance with the national legislation and the institutional requirements.
Author contributions
IK, EL, and AK collected the samples. IK, DS, TD, and DM performed the IHC reactions. IK and DS participated in performing FISH reactions and evaluation of the results. IK and JP evaluated the IHC reactions. IK, DS, and DM were responsible for the TCGA data analysis and statistical analysis. IK, AS, DS, and AK evaluated the results. IK and AK wrote the manuscript. AK supervised the project. All authors contributed to the article and approved the submitted version.
Funding
The study was supported by the grant of the Hungarian National Research, Development and Innovation Office (NKFI-FK-128404, AS; NTP-NFTÖ-21-B-0179, IK) and the ÚNKP-23-4-II New National Excellence Program of the Ministry for Culture and Innovation from the Source of the National Research, Development and Innovation Fund (ÚNKP-23-4-II-SE-9, IK).
Acknowledgments
The authors are grateful to Tracy L. Majewicz (Department of Laboratory Medicine and Pathology, Mayo Clinic) and Dóra Kapczár (Department of Pathology and Experimental Cancer Research, Semmelweis University) for their technical assistance. The results were presented in part at the 2023 World Conference on Lung Cancer (Singapore).
Conflict of interest
The authors declare that the research was conducted in the absence of any commercial or financial relationships that could be construed as a potential conflict of interest.
Footnotes
References
1.
Bray F Ferlay J Soerjomataram I Siegel RL Torre LA Jemal A . Global cancer statistics 2018: GLOBOCAN estimates of incidence and mortality worldwide for 36 cancers in 185 countries. CA Cancer J Clin (2018) 68:394–424. 10.3322/caac.21492
2.
Herbst RS Morgensztern D Boshoff C . The biology and management of non-small cell lung cancer. Nature (2018) 553:446–54. 10.1038/nature25183
3.
Anusewicz D Orzechowska M Bednarek AK . Lung squamous cell carcinoma and lung adenocarcinoma differential gene expression regulation through pathways of Notch, Hedgehog, Wnt, and ErbB signalling. Sci Rep (2020) 10:21128. 10.1038/s41598-020-77284-8
4.
Sharma A Merritt E Hu X Cruz A Jiang C Sarkodie H et al Non-genetic intra-tumor heterogeneity is a major predictor of phenotypic heterogeneity and ongoing evolutionary dynamics in lung tumors. Cell Rep (2019) 29:2164–74. 10.1016/j.celrep.2019.10.045
5.
Santos ES Rodriguez E . Treatment considerations for patients with advanced squamous cell carcinoma of the lung. Clin Lung Cancer (2022) 23:457–66. 10.1016/j.cllc.2022.06.002
6.
National Comprehensive Cancer Network. Non-small cell lung cancer (2022). Version: 5.
7.
Saxton RA Sabatini DM . mTOR signaling in growth, metabolism, and disease. Cell (2017) 168:960–76. 10.1016/j.cell.2017.02.004
8.
Krencz I Sebestyen A Papay J Lou Y Lutz GF Majewicz TL et al Correlation between immunohistochemistry and RICTOR fluorescence in situ hybridization amplification in small cell lung carcinoma. Hum Pathol (2019) 93:74–80. 10.1016/j.humpath.2019.08.018
9.
Krencz I Sztankovics D Danko T Sebestyen A Khoor A . Progression and metastasis of small cell lung carcinoma: the role of the PI3K/Akt/mTOR pathway and metabolic alterations. Cancer Metastasis Rev (2021) 40:1141–57. 10.1007/s10555-021-10012-4
10.
Sztankovics D Krencz I Moldvai D Dankó T Nagy Á Nagy N et al Novel RICTOR amplification harbouring entities: FISH validation of RICTOR amplification in tumour tissue after next-generation sequencing. Sci Rep (2023) 13:19610. 10.1038/s41598-023-46927-x
11.
Krencz I Sebestyen A Khoor A . mTOR in lung neoplasms. Pathol Oncol Res (2020) 26:35–48. 10.1007/s12253-020-00796-1
12.
Sholl LM Sun H Butaney M Zhang C Lee C Jänne PA et al ROS1 immunohistochemistry for detection of ROS1-rearranged lung adenocarcinomas. Am J Surg Pathol (2013) 37:1441–9. 10.1097/PAS.0b013e3182960fa7
13.
Wynes MW Sholl LM Dietel M Schuuring E Tsao MS Yatabe Y et al An international interpretation study using the ALK IHC antibody D5F3 and a sensitive detection kit demonstrates high concordance between ALK IHC and ALK FISH and between evaluators. J Thorac Oncol (2014) 9:631–8. 10.1097/JTO.0000000000000115
14.
Nicholson AG Tsao MS Beasley MB Borczuk AC Brambilla E Cooper WA et al The 2021 WHO classification of lung tumors: impact of advances since 2015. J Thorac Oncol (2022) 17:362–87. 10.1016/j.jtho.2021.11.003
15.
Garon EB Rizvi NA Hui R Leighl N Balmanoukian AS Eder JP et al Pembrolizumab for the treatment of non-small-cell lung cancer. N Engl J Med (2015) 372:2018–28. 10.1056/NEJMoa1501824
16.
Herbst RS Baas P Kim DW Felip E Pérez-Gracia JL Han JY et al Pembrolizumab versus docetaxel for previously treated, PD-L1-positive, advanced non-small-cell lung cancer (KEYNOTE-010): a randomised controlled trial. Lancet (2016) 387:1540–50. 10.1016/S0140-6736(15)01281-7
17.
Gao J Aksoy BA Dogrusoz U Dresdner G Gross B Sumer SO et al Integrative analysis of complex cancer genomics and clinical profiles using the cBioPortal. Sci Signal (2013) 6:pl1. 10.1126/scisignal.2004088
18.
Cerami E Gao J Dogrusoz U Gross BE Sumer SO Aksoy BA et al The cBio cancer genomics portal: an open platform for exploring multidimensional cancer genomics data. Cancer Discov (2012) 2:401–4. 10.1158/2159-8290.CD-12-0095
19.
Cheng H Zou Y Ross JS Wang K Liu X Halmos B et al RICTOR amplification defines a novel subset of patients with lung cancer who may benefit from treatment with mTORC1/2 inhibitors. Cancer Discov (2015) 5:1262–70. 10.1158/2159-8290.CD-14-0971
20.
Kim LC Rhee CH Chen J . RICTOR amplification promotes NSCLC cell proliferation through formation and activation of mTORC2 at the expense of mTORC1. Mol Cancer Res (2020) 18:1675–84. 10.1158/1541-7786.MCR-20-0262
21.
Bang H Ahn S Ji Kim E Kim ST Park HY Lee J et al Correlation between RICTOR overexpression and amplification in advanced solid tumors. Pathol Res Pract (2020) 216:152734. 10.1016/j.prp.2019.152734
22.
Munari E Zamboni G Lunardi G Marchionni L Marconi M Sommaggio M et al PD-L1 expression heterogeneity in non-small cell lung cancer: defining criteria for harmonization between biopsy specimens and whole sections. J Thorac Oncol (2018) 13:1113–20. 10.1016/j.jtho.2018.04.017
23.
Ben Dori S Aizic A Sabo E Hershkovitz D . Spatial heterogeneity of PD-L1 expression and the risk for misclassification of PD-L1 immunohistochemistry in non-small cell lung cancer. Lung Cancer (2020) 147:91–8. 10.1016/j.lungcan.2020.07.012
24.
Oh WJ Jacinto E . mTOR complex 2 signaling and functions. Cell Cycle (2011) 10:2305–16. 10.4161/cc.10.14.16586
25.
Boulbés DR Shaiken T Sarbassov dos D . Endoplasmic reticulum is a main localization site of mTORC2. Biochem Biophys Res Commun (2011) 413:46–52. 10.1016/j.bbrc.2011.08.034
26.
Gleason CE Oses-Prieto JA Li KH Saha B Situ G Burlingame AL et al Phosphorylation at distinct subcellular locations underlies specificity in mTORC2-mediated activation of SGK1 and Akt. J Cel Sci (2019) 132:jcs224931. 10.1242/jcs.224931
27.
McDonald PC Oloumi A Mills J Dobreva I Maidan M Gray V et al Rictor and integrin-linked kinase interact and regulate Akt phosphorylation and cancer cell survival. Cancer Res (2008) 68:1618–24. 10.1158/0008-5472.CAN-07-5869
28.
Tsirtsaki K Gkretsi V . The focal adhesion protein Integrin-Linked Kinase (ILK) as an important player in breast cancer pathogenesis. Cell Adh Migr (2020) 14:204–13. 10.1080/19336918.2020.1829263
29.
Luciano AK Korobkina ED Lyons SP Haley JA Fluharty SM Jung SM et al Proximity labeling of endogenous RICTOR identifies mTOR complex 2 regulation by ADP ribosylation factor ARF1. J Biol Chem (2022) 298:102379. 10.1016/j.jbc.2022.102379
30.
Lau SCM Pan Y Velcheti V Wong KK . Squamous cell lung cancer: current landscape and future therapeutic options. Cancer Cell (2022) 40:1279–93. 10.1016/j.ccell.2022.09.018
31.
Yang CY Lin MW Chang YL Wu CT Yang PC . Programmed cell death-ligand 1 expression is associated with a favourable immune microenvironment and better overall survival in stage I pulmonary squamous cell carcinoma. Eur J Cancer (2016) 57:91–103. 10.1016/j.ejca.2015.12.033
32.
Fruman DA Chiu H Hopkins BD Bagrodia S Cantley LC Abraham RT . The PI3K pathway in human disease. Cell (2017) 170:605–35. 10.1016/j.cell.2017.07.029
33.
Guenzle J Akasaka H Joechle K Reichardt W Venkatasamy A Hoeppner J et al Pharmacological inhibition of mTORC2 reduces migration and metastasis in melanoma. Int J Mol Sci (2020) 22:30. 10.3390/ijms22010030
34.
Werfel TA Wang S Jackson MA Kavanaugh TE Joly MM Lee LH et al Selective mTORC2 inhibitor therapeutically blocks breast cancer cell growth and survival. Cancer Res (2018) 78:1845–58. 10.1158/0008-5472.CAN-17-2388
35.
Xu Y Li H Huang Z Chen K Yu X Sheng J et al Predictive values of genomic variation, tumor mutational burden, and PD-L1 expression in advanced lung squamous cell carcinoma treated with immunotherapy. Transl Lung Cancer Res (2020) 9:2367–79. 10.21037/tlcr-20-1130
36.
Jebali A Battistella M Lebbé C Dumaz N . RICTOR affects melanoma tumorigenesis and its resistance to targeted therapy. Biomedicines (2021) 9:1498. 10.3390/biomedicines9101498
37.
Sun D Yan W Zhu H Liu Q Hou H . Case report: primary and acquired resistance mechanisms of nimotuzumab in advanced esophageal squamous cell carcinoma revealed by targeted sequencing. Front Oncol (2020) 10:574523. 10.3389/fonc.2020.574523
38.
Zhao D Jiang M Zhang X Hou H . The role of RICTOR amplification in targeted therapy and drug resistance. Mol Med (2020) 26:20. 10.1186/s10020-020-0146-6
39.
Krencz I Sebestyén A Fábián K Márk Á Moldvay J Khoor A et al Expression of mTORC1/2-related proteins in primary and brain metastatic lung adenocarcinoma. Hum Pathol (2017) 62:66–73. 10.1016/j.humpath.2016.12.012
40.
Schmidt KM Dietrich P Hackl C Guenzle J Bronsert P Wagner C et al Inhibition of mTORC2/RICTOR impairs melanoma hepatic metastasis. Neoplasia (2018) 20:1198–208. 10.1016/j.neo.2018.10.001
41.
Sakre N Wildey G Behtaj M Kresak A Yang M Fu P et al RICTOR amplification identifies a subgroup in small cell lung cancer and predicts response to drugs targeting mTOR. Oncotarget (2017) 8:5992–6002. 10.18632/oncotarget.13362
Summary
Keywords
RICTOR amplification, Rictor expression, mTORC2, PD-L1, lung squamous cell carcinoma
Citation
Krencz I, Sztankovics D, Sebestyén A, Pápay J, Dankó T, Moldvai D, Lutz E and Khoor A (2024) RICTOR amplification is associated with Rictor membrane staining and does not correlate with PD-L1 expression in lung squamous cell carcinoma. Pathol. Oncol. Res. 30:1611593. doi: 10.3389/pore.2024.1611593
Received
17 November 2023
Accepted
04 April 2024
Published
19 April 2024
Volume
30 - 2024
Edited by
József Tímár, Semmelweis University, Hungary
Updates
Copyright
© 2024 Krencz, Sztankovics, Sebestyén, Pápay, Dankó, Moldvai, Lutz and Khoor.
This is an open-access article distributed under the terms of the Creative Commons Attribution License (CC BY). The use, distribution or reproduction in other forums is permitted, provided the original author(s) and the copyright owner(s) are credited and that the original publication in this journal is cited, in accordance with accepted academic practice. No use, distribution or reproduction is permitted which does not comply with these terms.
*Correspondence: Andras Khoor, khoor.andras@mayo.edu
Disclaimer
All claims expressed in this article are solely those of the authors and do not necessarily represent those of their affiliated organizations, or those of the publisher, the editors and the reviewers. Any product that may be evaluated in this article or claim that may be made by its manufacturer is not guaranteed or endorsed by the publisher.